Data in, video out
Paste cells from Excel, Google Sheets or Numbers, open a CSV, Excel or JSON file, or link a published sheet. The layout, dates and number formats are worked out for you, and anything odd is explained in plain English.
Free · runs in your browser · no sign-up
Paste a table, pick a chart and press play: animated charts from bar chart races to lines that draw themselves, pies and counters. Export an MP4 up to 4K, a GIF, a transparent overlay or a still PNG or SVG, with nothing uploaded and no watermark.
Paste cells from Excel, Google Sheets or Numbers, open a CSV, Excel or JSON file, or link a published sheet. The layout, dates and number formats are worked out for you, and anything odd is explained in plain English.
Values glide between periods without overshooting, race bars overtake smoothly, axes rescale without jumps, and labels move out of each other’s way on every frame.
MP4 at 1080p or 4K and 30 or 60 fps, GIF and transparent WebM, or the finished chart as a PNG or SVG, in 16:9, 9:16, 1:1 and 4:5. Each frame is drawn on your device; there’s no account and no watermark.
How it works
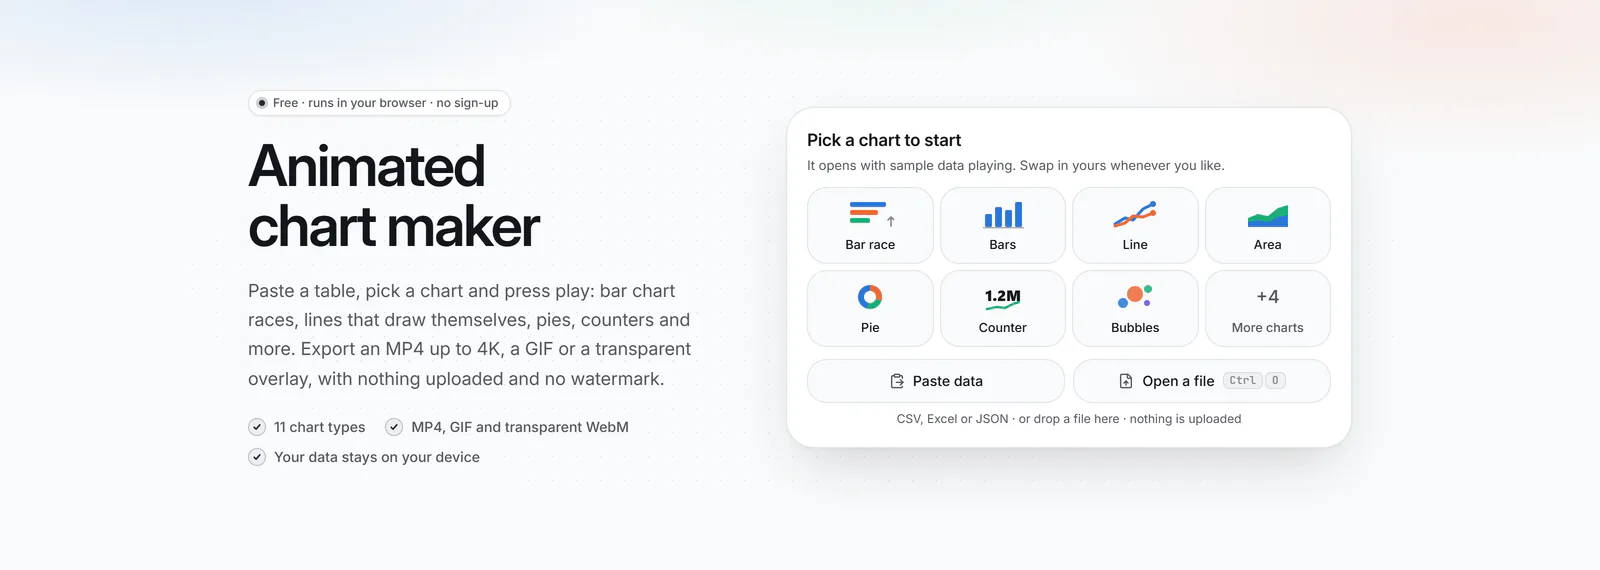
Under Pick a chart to start, choose Bar race, Line, Pie, Counter or another chart. The studio opens with sample data already playing.
 (enlarge image)
Pick a chart under Pick a chart to start.
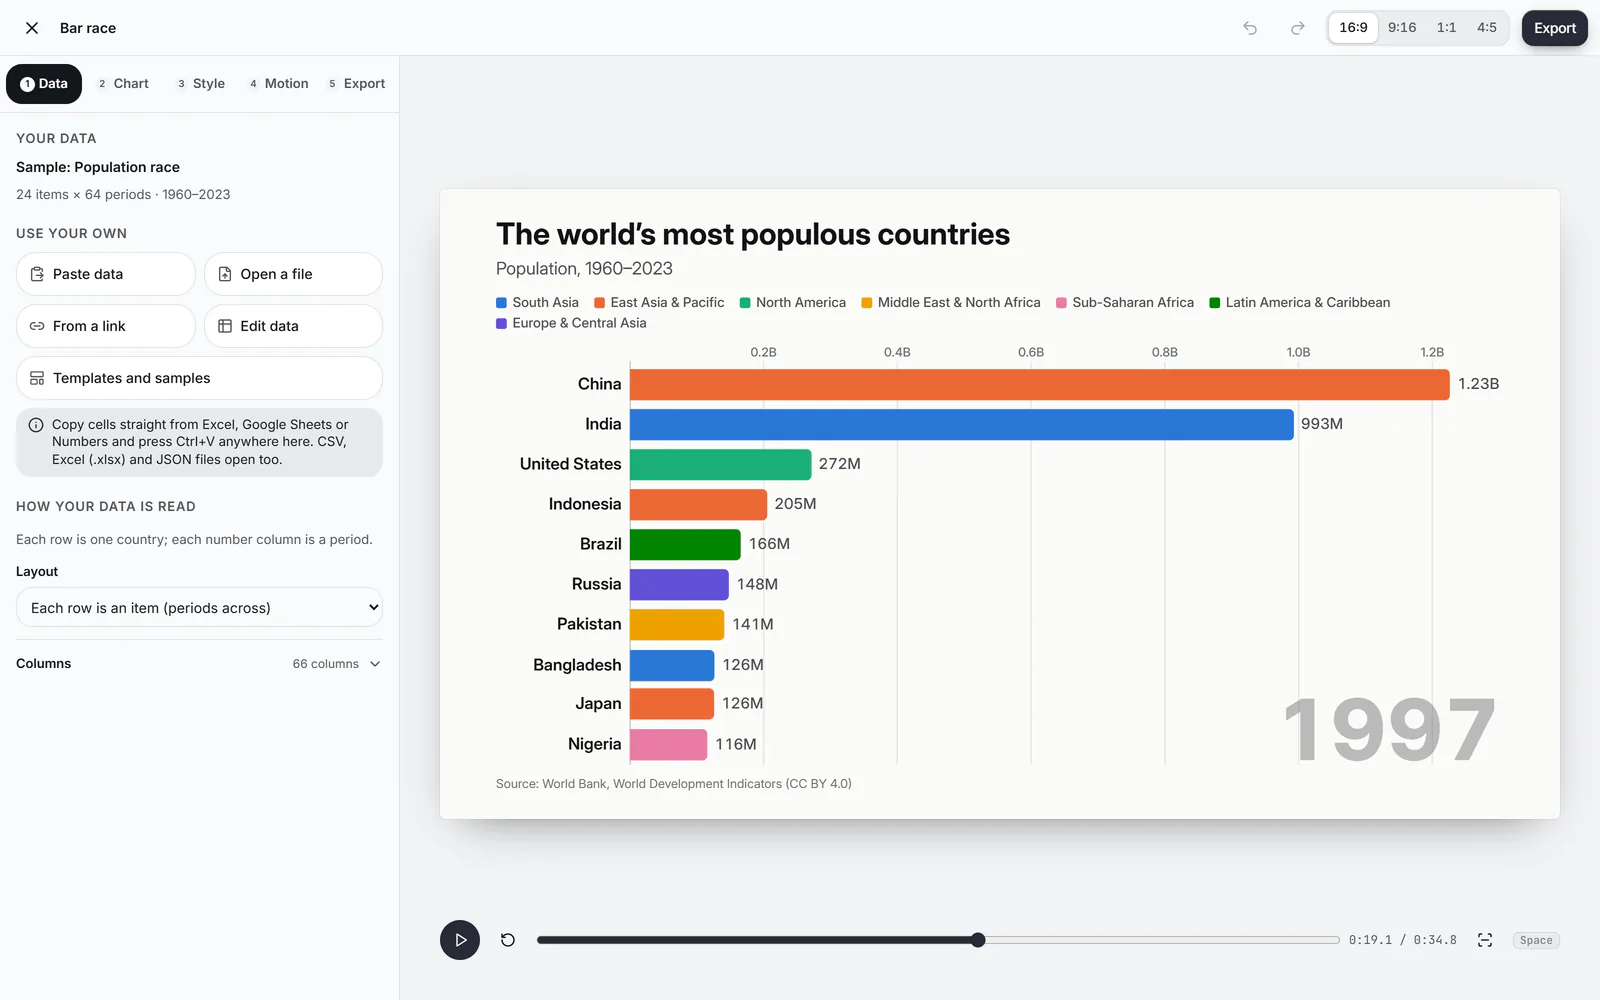
In the Data step, use Paste data, Open a file or Google Sheets. The preview replays with your numbers straight away.
 (enlarge image)
The Data step: Paste data, Open a file, From a link and Edit data.
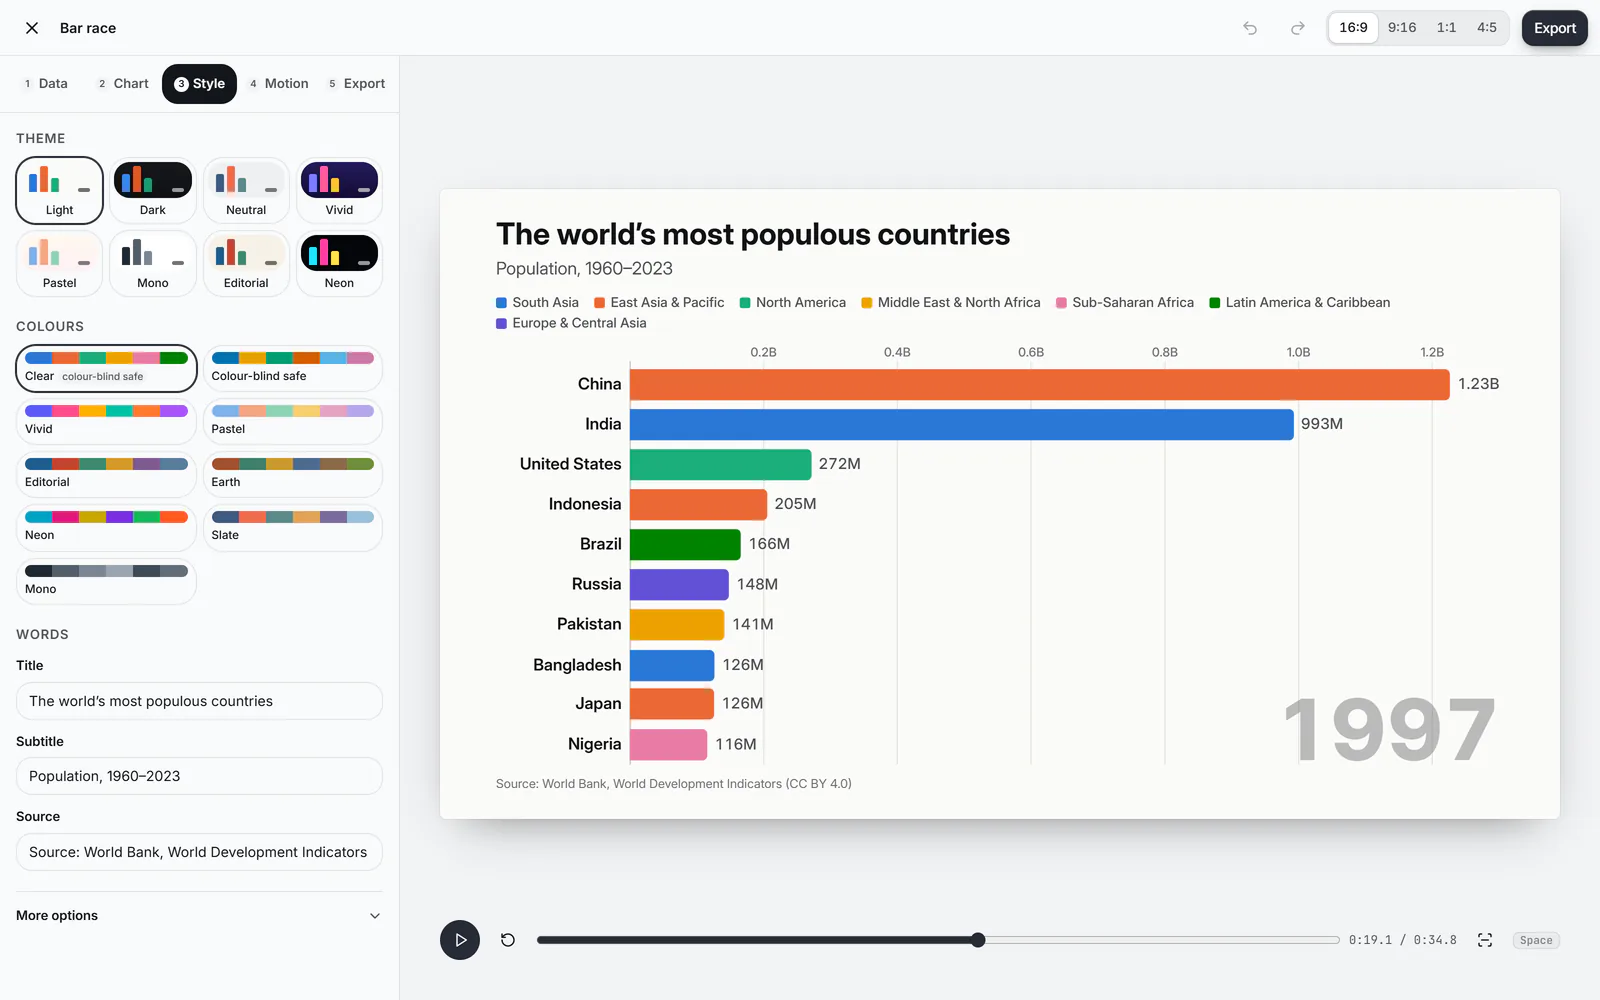
Use Chart, Style and Timing to set the options, look, words and pace. Everything else waits under More options.
 (enlarge image)
The Style step: theme, colours and words.
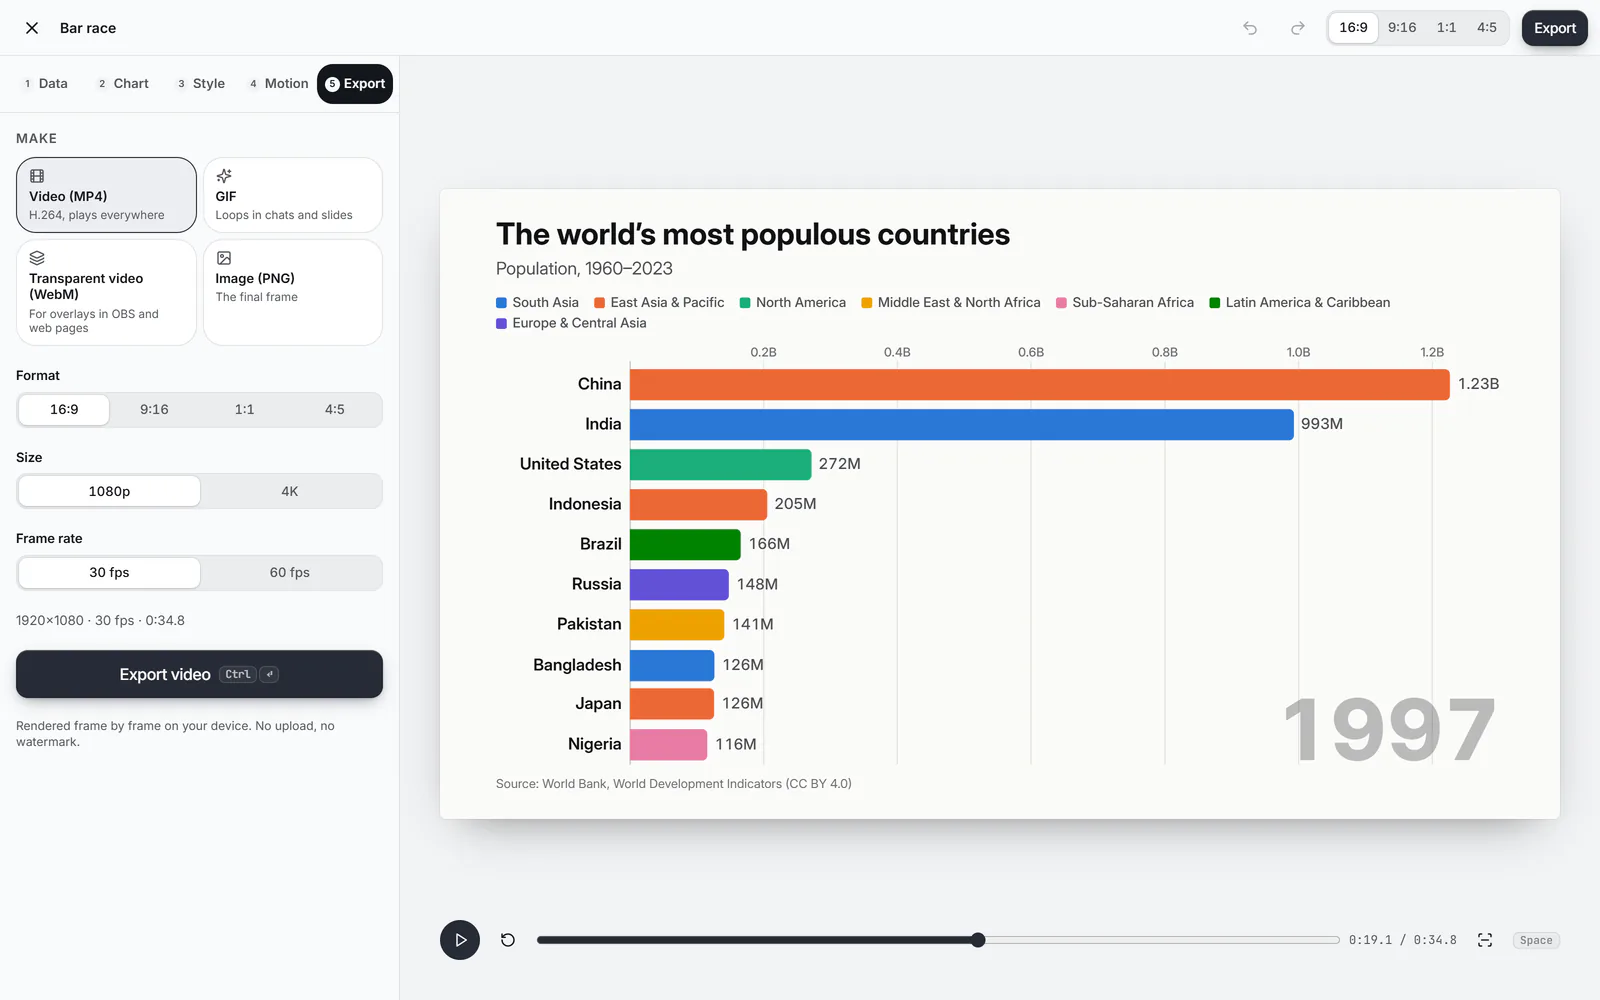
In Export, choose Video (MP4), GIF, Transparent video (WebM), Image (PNG) or Vector image (SVG), the format and size, and press the export button.
 (enlarge image)
The Export step.
Charts and guides
Need a plain chart for a report, a slide or homework? These open on PNG and SVG export, and the same chart plays as a video when you want it to move.
Everything from reading your spreadsheet to encoding the video happens in your browser. The guides above cover PowerPoint, Keynote, Canva, After Effects and Excel.
A free tool that turns a table of numbers into animated charts (a bar chart race, a line that draws itself, a morphing pie, a counting number) and exports them as MP4, GIF or transparent WebM, or as a still PNG or SVG, all inside your browser.
Yes. Every chart type and export, including 4K and 60 fps, is free. There is no watermark and no account.
No. The spreadsheet, the chart, your logo and your music stay on your device; the browser draws and encodes every frame itself. Charts are saved in this browser so you can come back to them.
Bar race, bars and columns (grouped or stacked), line, area, pie and donut, number counters, bubble races (animated scatter plots), treemaps, waffles, progress bars and gauges, and A vs B comparisons.
Anything you can copy from a spreadsheet, plus CSV, TSV, Excel (.xlsx) and JSON files, Google Sheets published as CSV, and public CSV links your browser is allowed to read. A built-in grid lets you type or fix values.
Either one row per item with a column per period (the usual bar chart race layout), one row per period with a column per series (the usual spreadsheet), or one value per row. The studio detects which, and you can switch it under Layout.
16:9 (1920×1080 or 3840×2160), 9:16 (1080×1920 or 2160×3840), 1:1 and 4:5, at 30 or 60 frames per second. GIFs come out at 480 or 720 pixels on the short side.
Yes. Image (PNG) saves the finished chart at standard or Sharp (2×) size, and Vector image (SVG) keeps it sharp at any size for print and design apps. The bar graph, line graph and pie chart makers open with the image export ready.
There are 22 free ones in the template gallery, each with a picture of the finished chart; they’re also under Samples in the studio’s Data step. The guide to creating animated charts compares this with PowerPoint, Excel, Canva and After Effects.
Yes. Turn on Transparent background in Style and export Transparent video (WebM) or Image (PNG). WebM transparency works in browsers, OBS Studio and FFmpeg-based editors; Premiere Pro, Final Cut Pro and DaVinci Resolve may show it on black.
Yes, your own: add a music file in Audio (with fade in and fade out), or a voiceover written from your chart, and a logo under Style → More options. No stock music or logos are included.
Yes. The preview and the export use the same renderer; the export draws every frame at full size, one after another, instead of recording the screen, so nothing is dropped or blurred.
Recent versions of Chrome, Edge, Safari and Firefox. Frame-by-frame video export uses WebCodecs; where a browser lacks it, the chart is recorded as it plays instead.
Yes. Charts autosave in your browser and appear under Continue a chart on the start card. Undo and redo work with the buttons or Ctrl+Z and Ctrl+Shift+Z.