Are the templates free to use?
Yes, for anything, including commercial videos. Charts made from them are yours. Keep the World Bank credit in the source line if you keep their data.
Free · runs in your browser · no sign-up
Twenty-two ready-made chart videos, each with sample data already moving. Open one, paste your own numbers over it, and export a video for YouTube, a presentation or a vertical feed.
Every template below is a complete animated chart: a chart type, a look, timing and a sample dataset, either real World Bank figures (CC BY 4.0) or made-up numbers labelled as sample data. Pick one and the studio opens with it playing; replace the data with Paste data or Open a file, and the design stays while your numbers take over.
Templates are a starting point, not a cage. Switch the chart type, the format (16:9, 9:16, 1:1 or 4:5), the theme or the pace at any time, and export as Video (MP4), GIF, Transparent video (WebM), Image (PNG) or Vector image (SVG). Nothing is uploaded and nothing is watermarked.
Each picture below is the template’s last frame, drawn by the same engine as the video. Pick one, and the studio opens with its sample data already playing; swap in your numbers whenever you like. Every template exports as an MP4, GIF, transparent WebM, PNG or SVG, in 16:9, 9:16, 1:1 or 4:5.
Items overtake each other as the years tick by, or spread out by three measures at once. The classics for YouTube history videos and “who leads” stories.
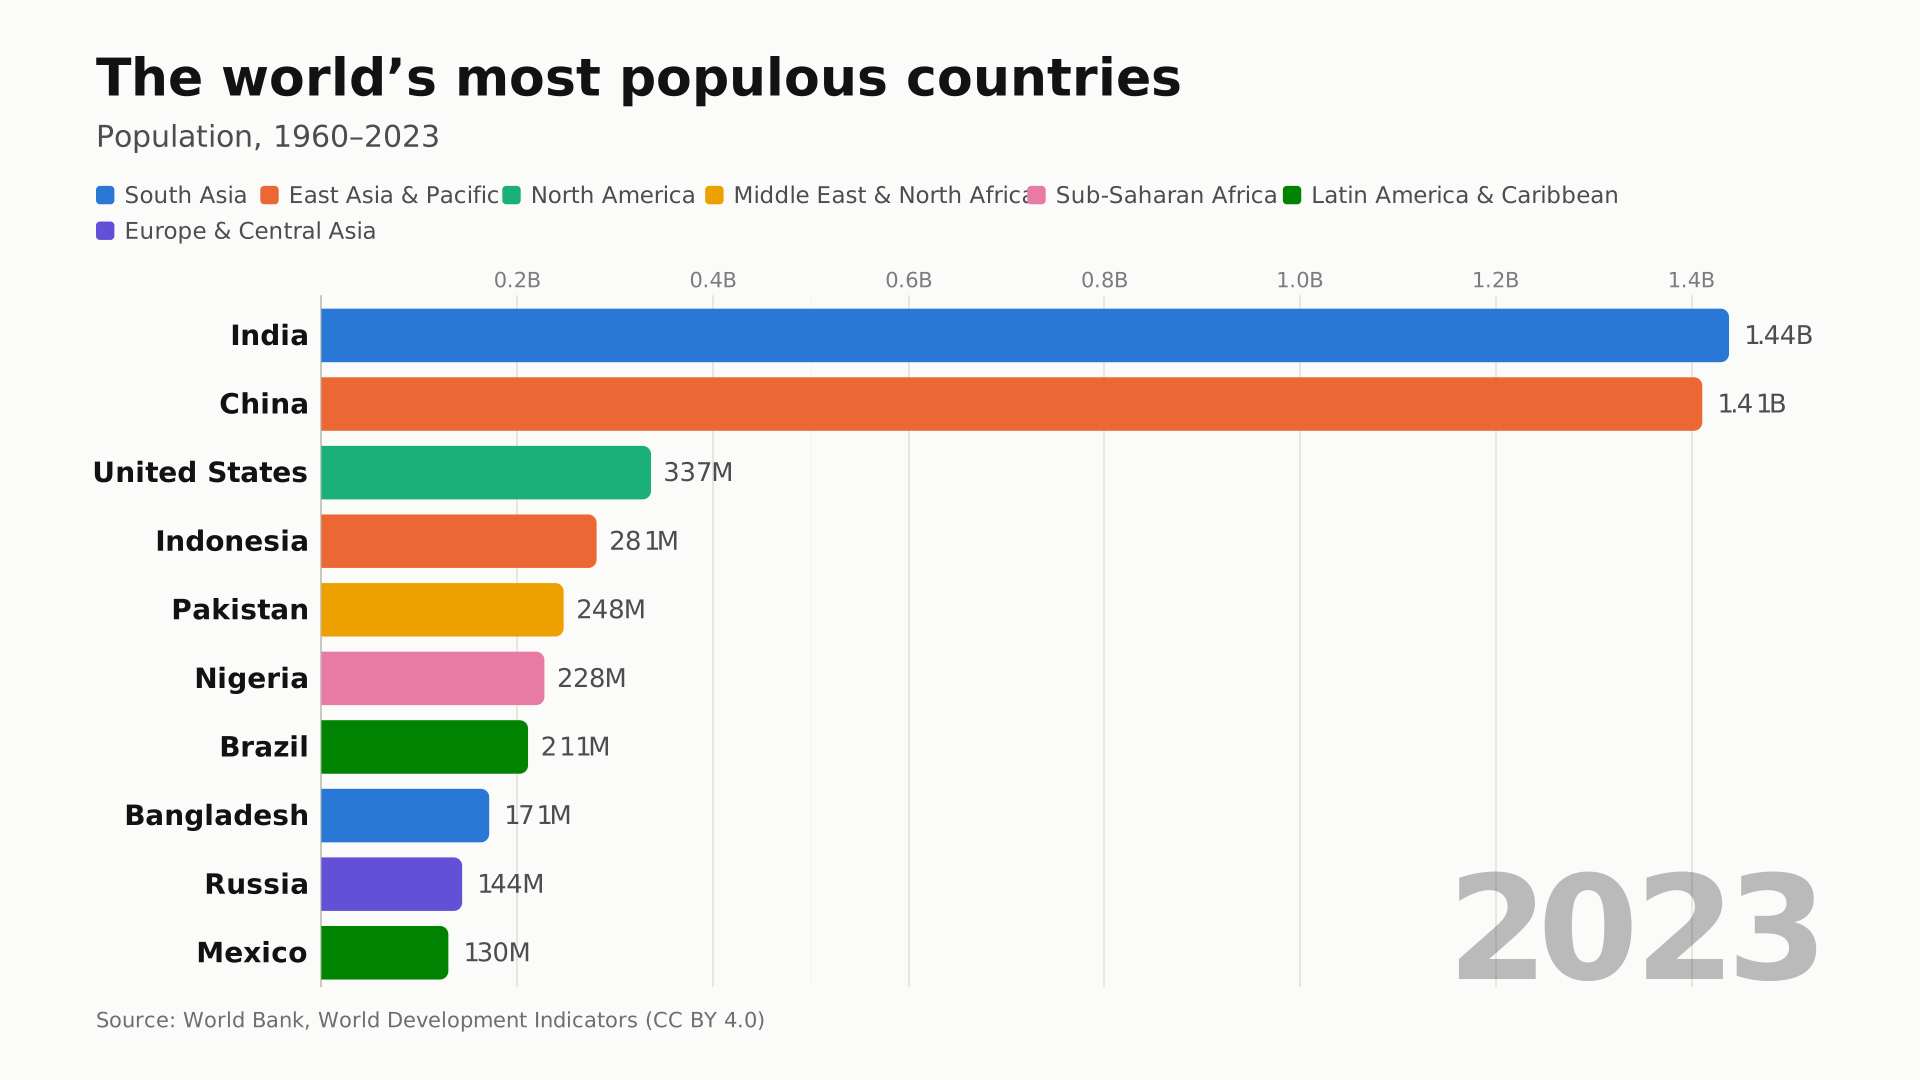
Population race
The 24 most populous countries, 1960–2023
Bar race · 16:9 widescreen · World Bank data
Use the Population race template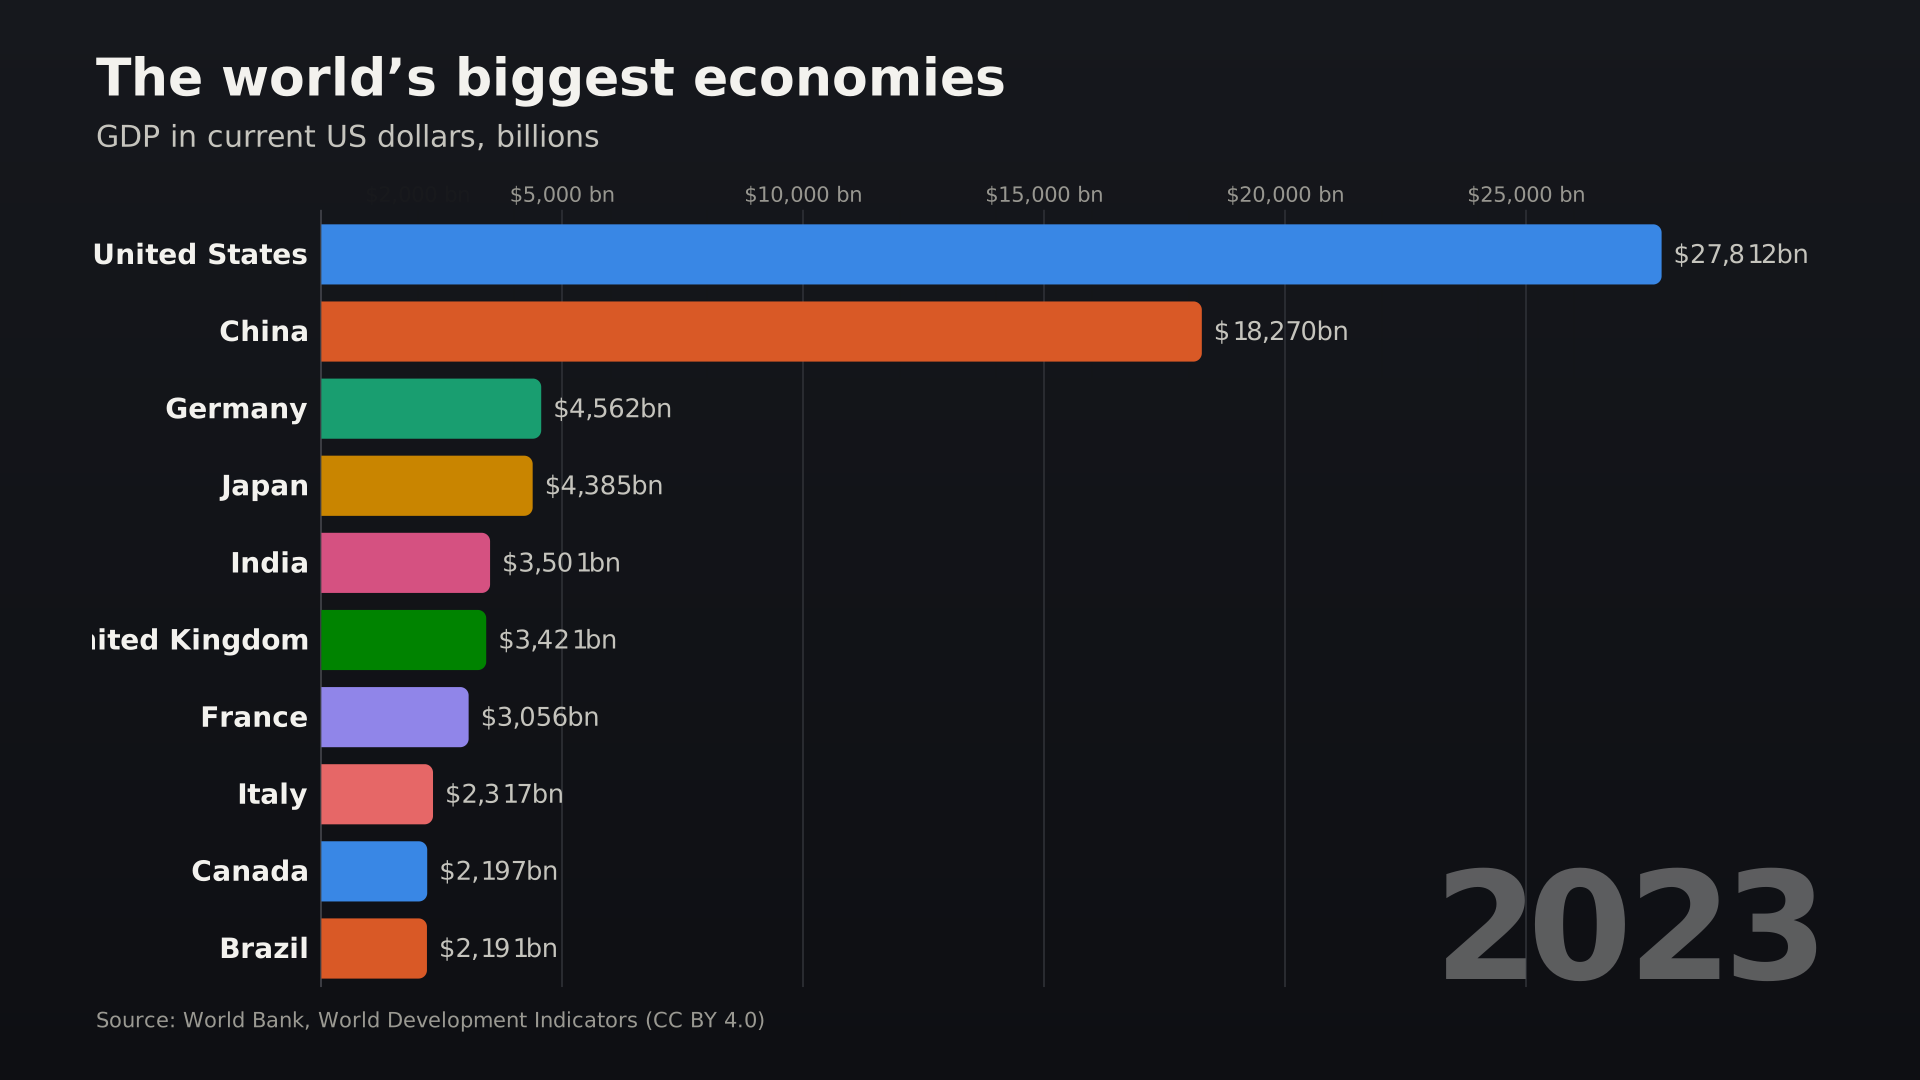
Biggest economies
GDP of 20 economies, 1980–2023
Bar race · 16:9 widescreen · World Bank data
Use the Biggest economies template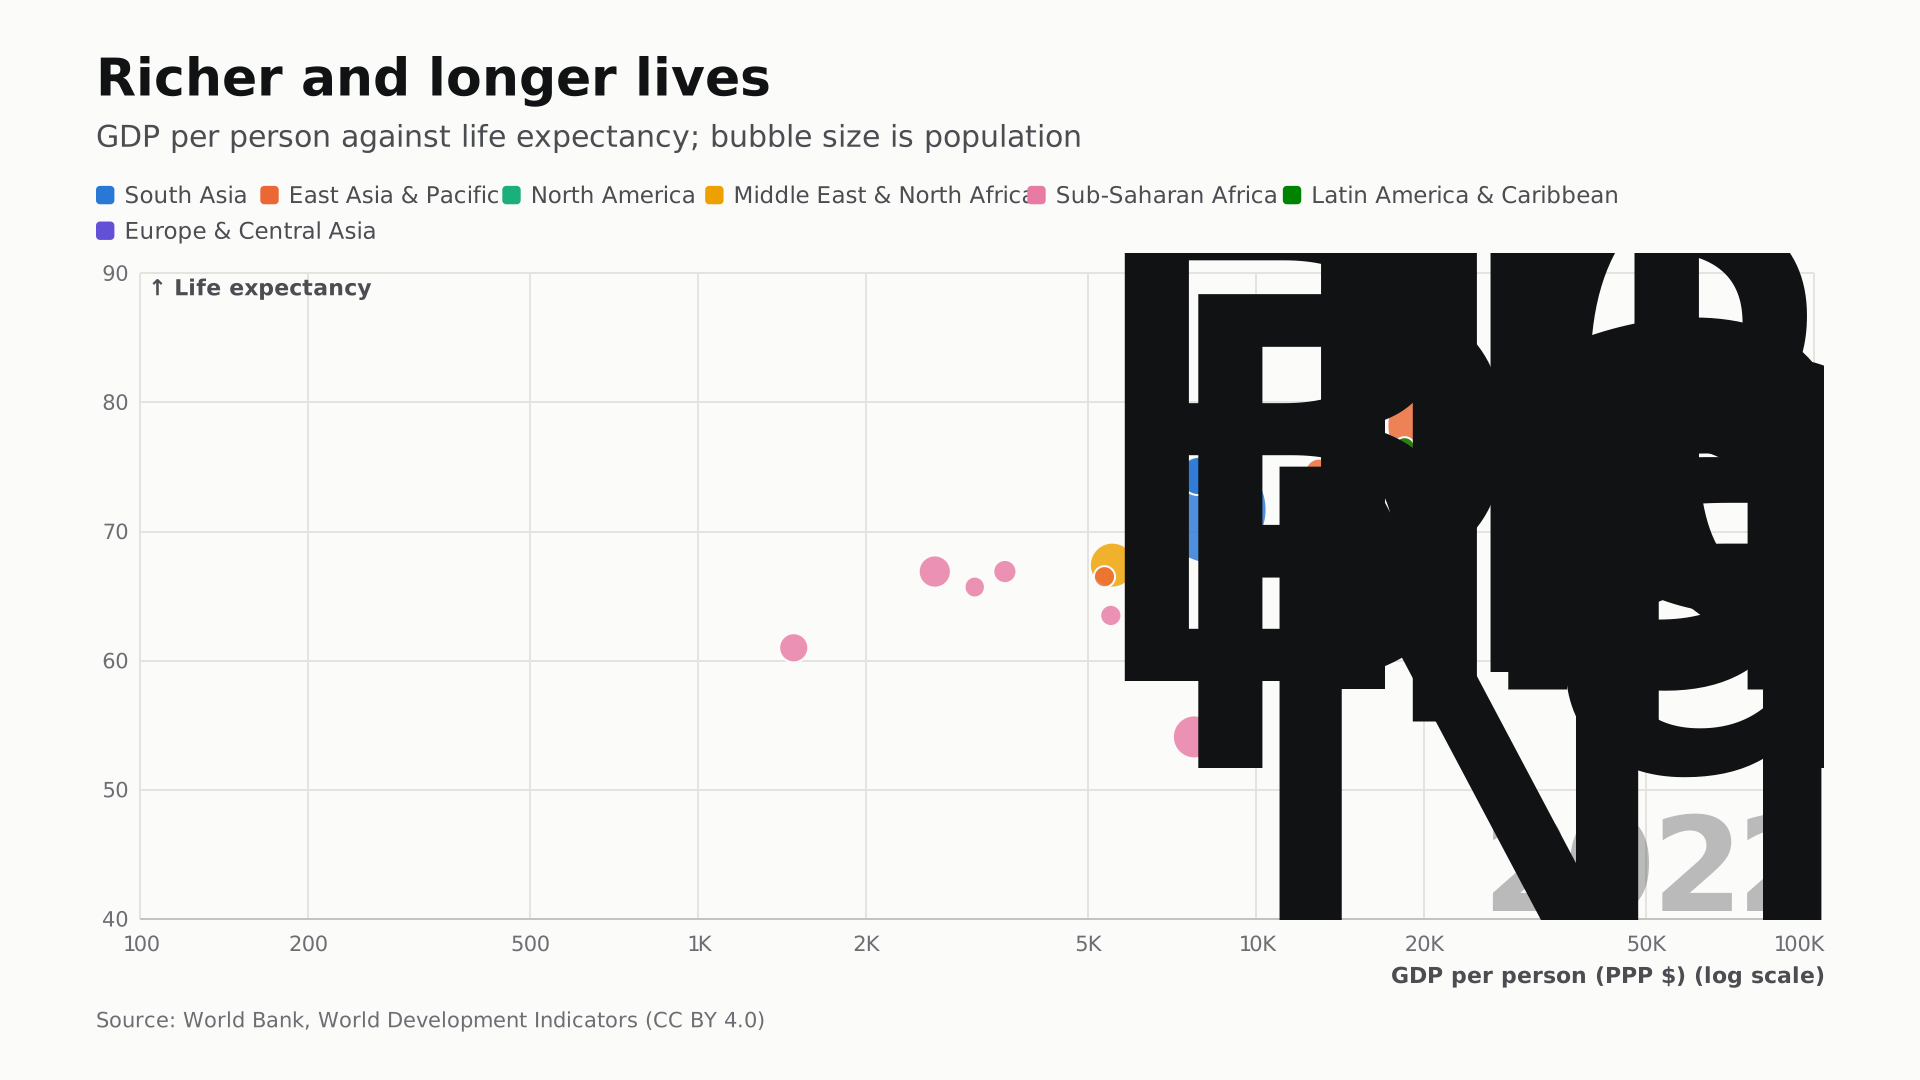
Wealth and health
A bubble race of 30 countries, 1990–2022
Bubbles · 16:9 widescreen · World Bank data
Use the Wealth and health template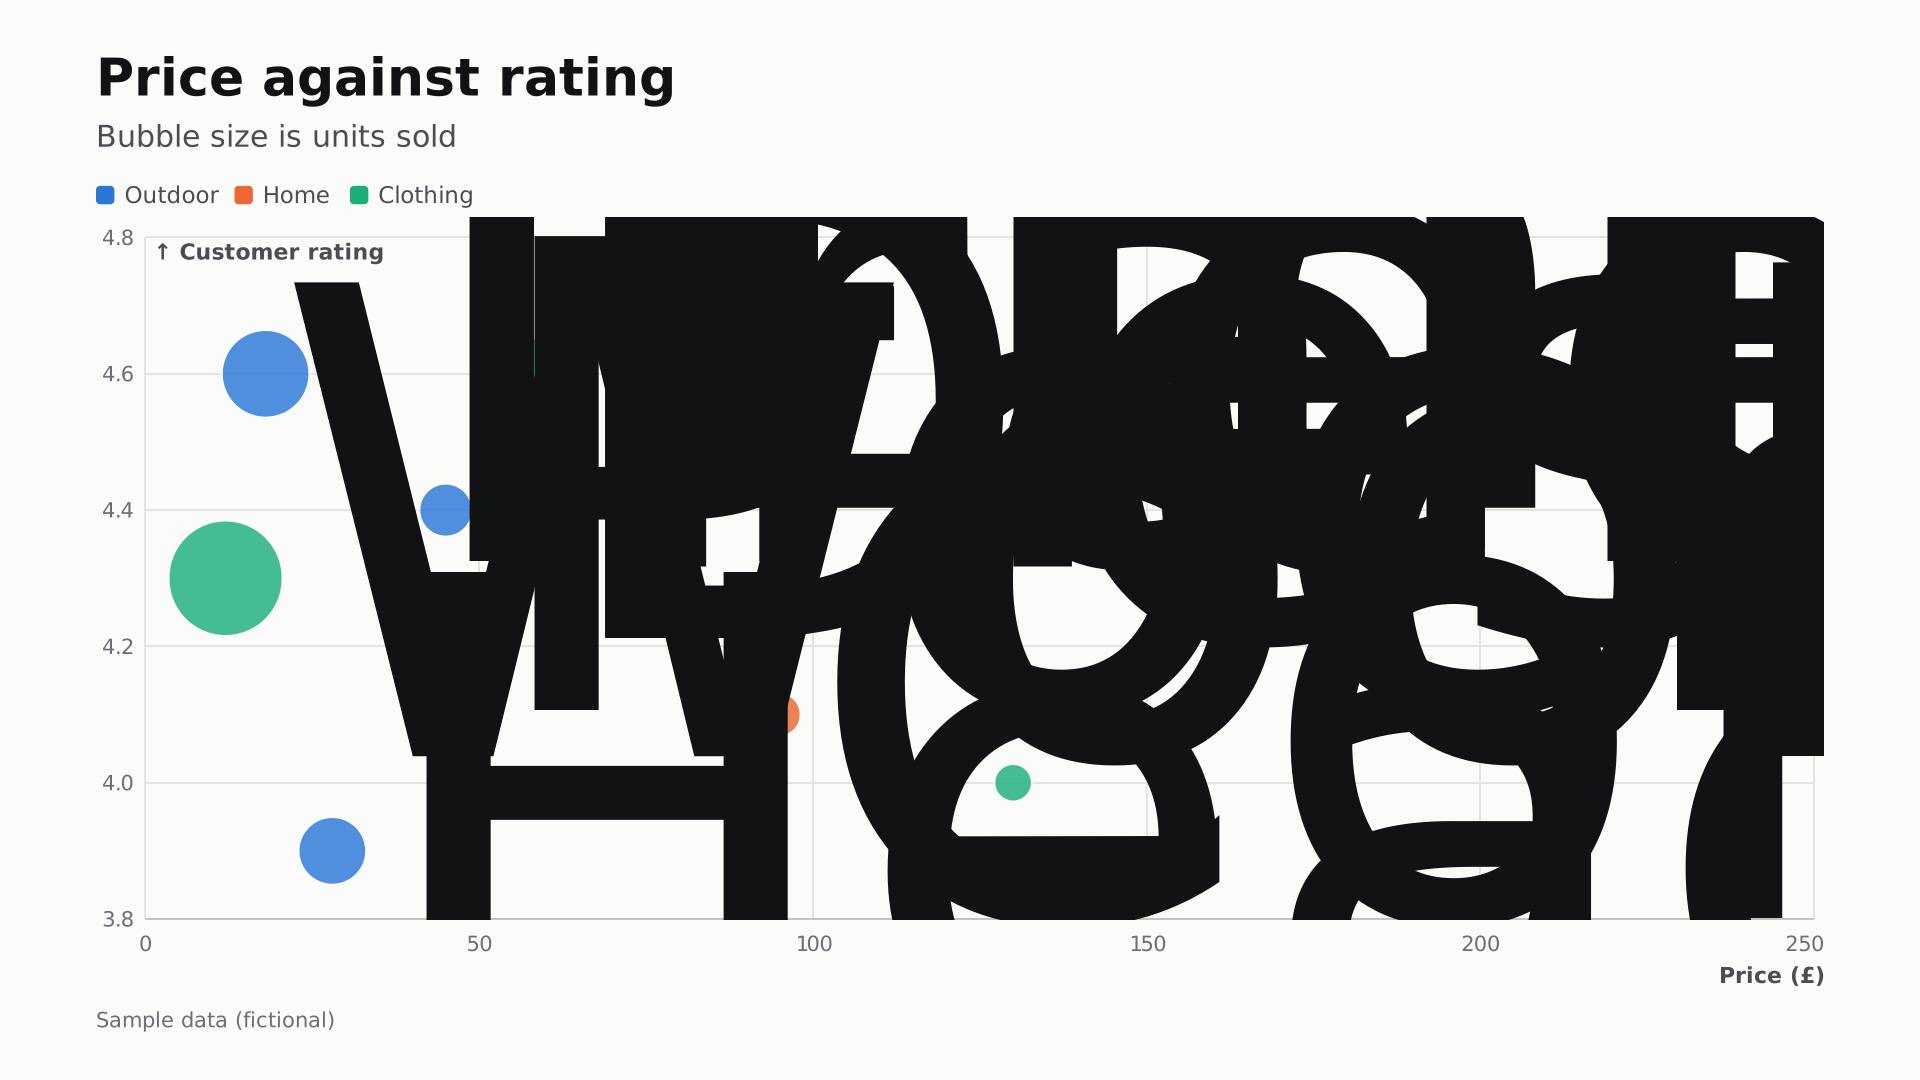
Product bubbles
Price, rating and sales of ten products
Bubbles · 16:9 widescreen · Sample data
Use the Product bubbles template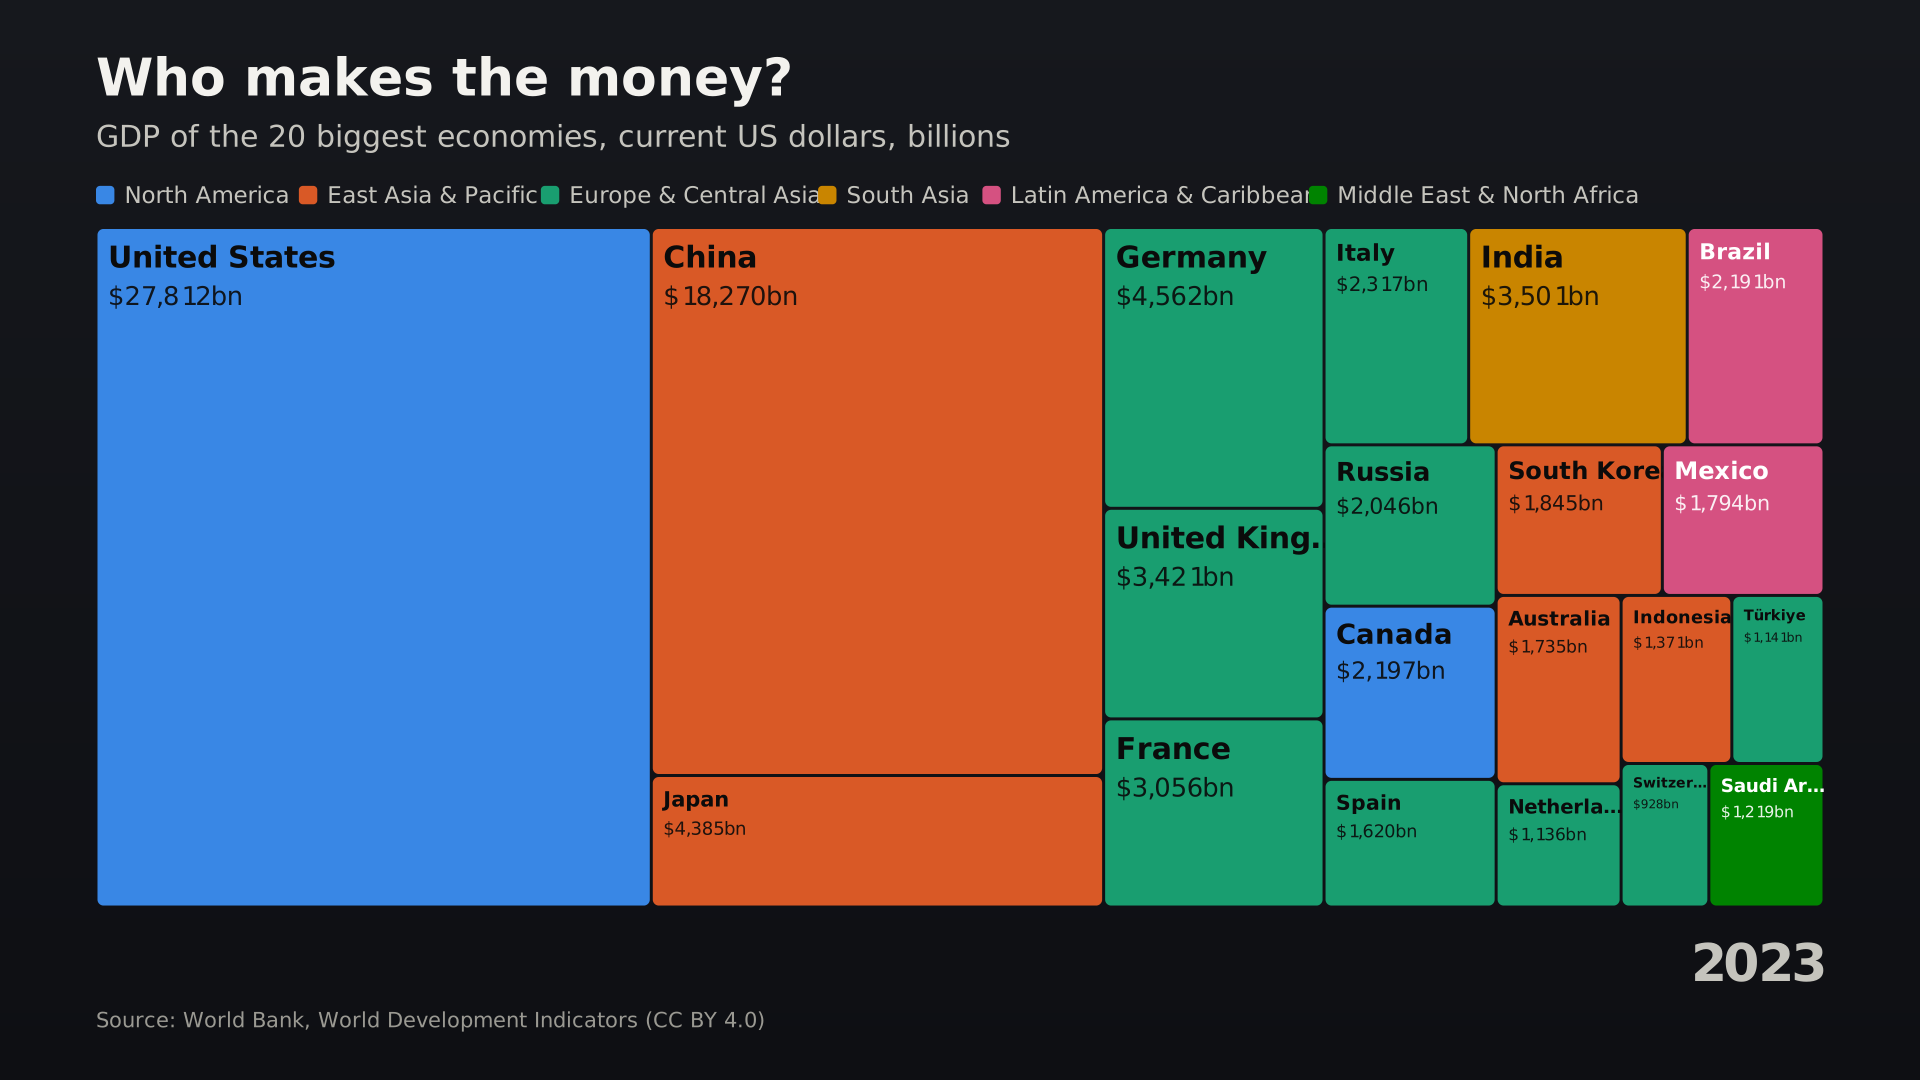
Economy treemap
Shares of GDP, morphing over time
Treemap · 16:9 widescreen · World Bank data
Use the Economy treemap templateLines that draw themselves from left to right, with labels riding the latest value.
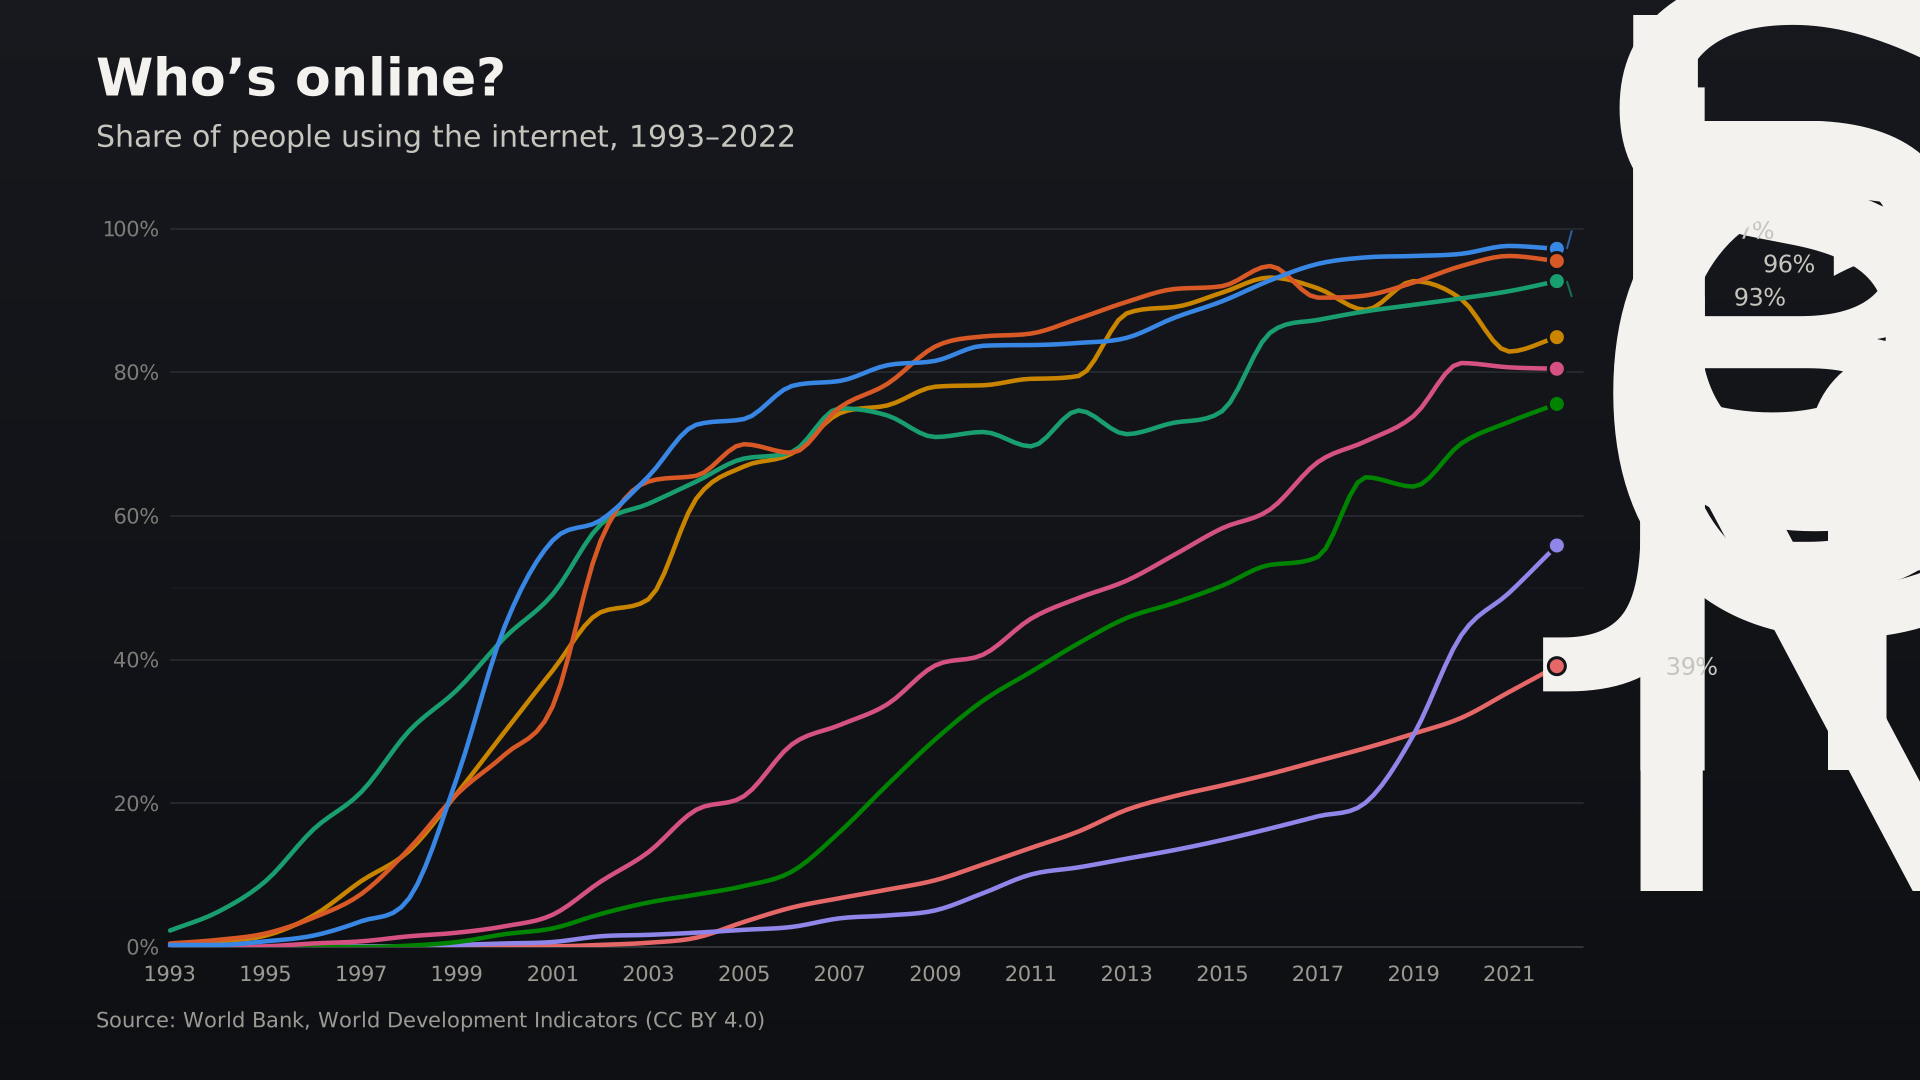
Getting online
Share of people using the internet
Line · 16:9 widescreen · World Bank data
Use the Getting online template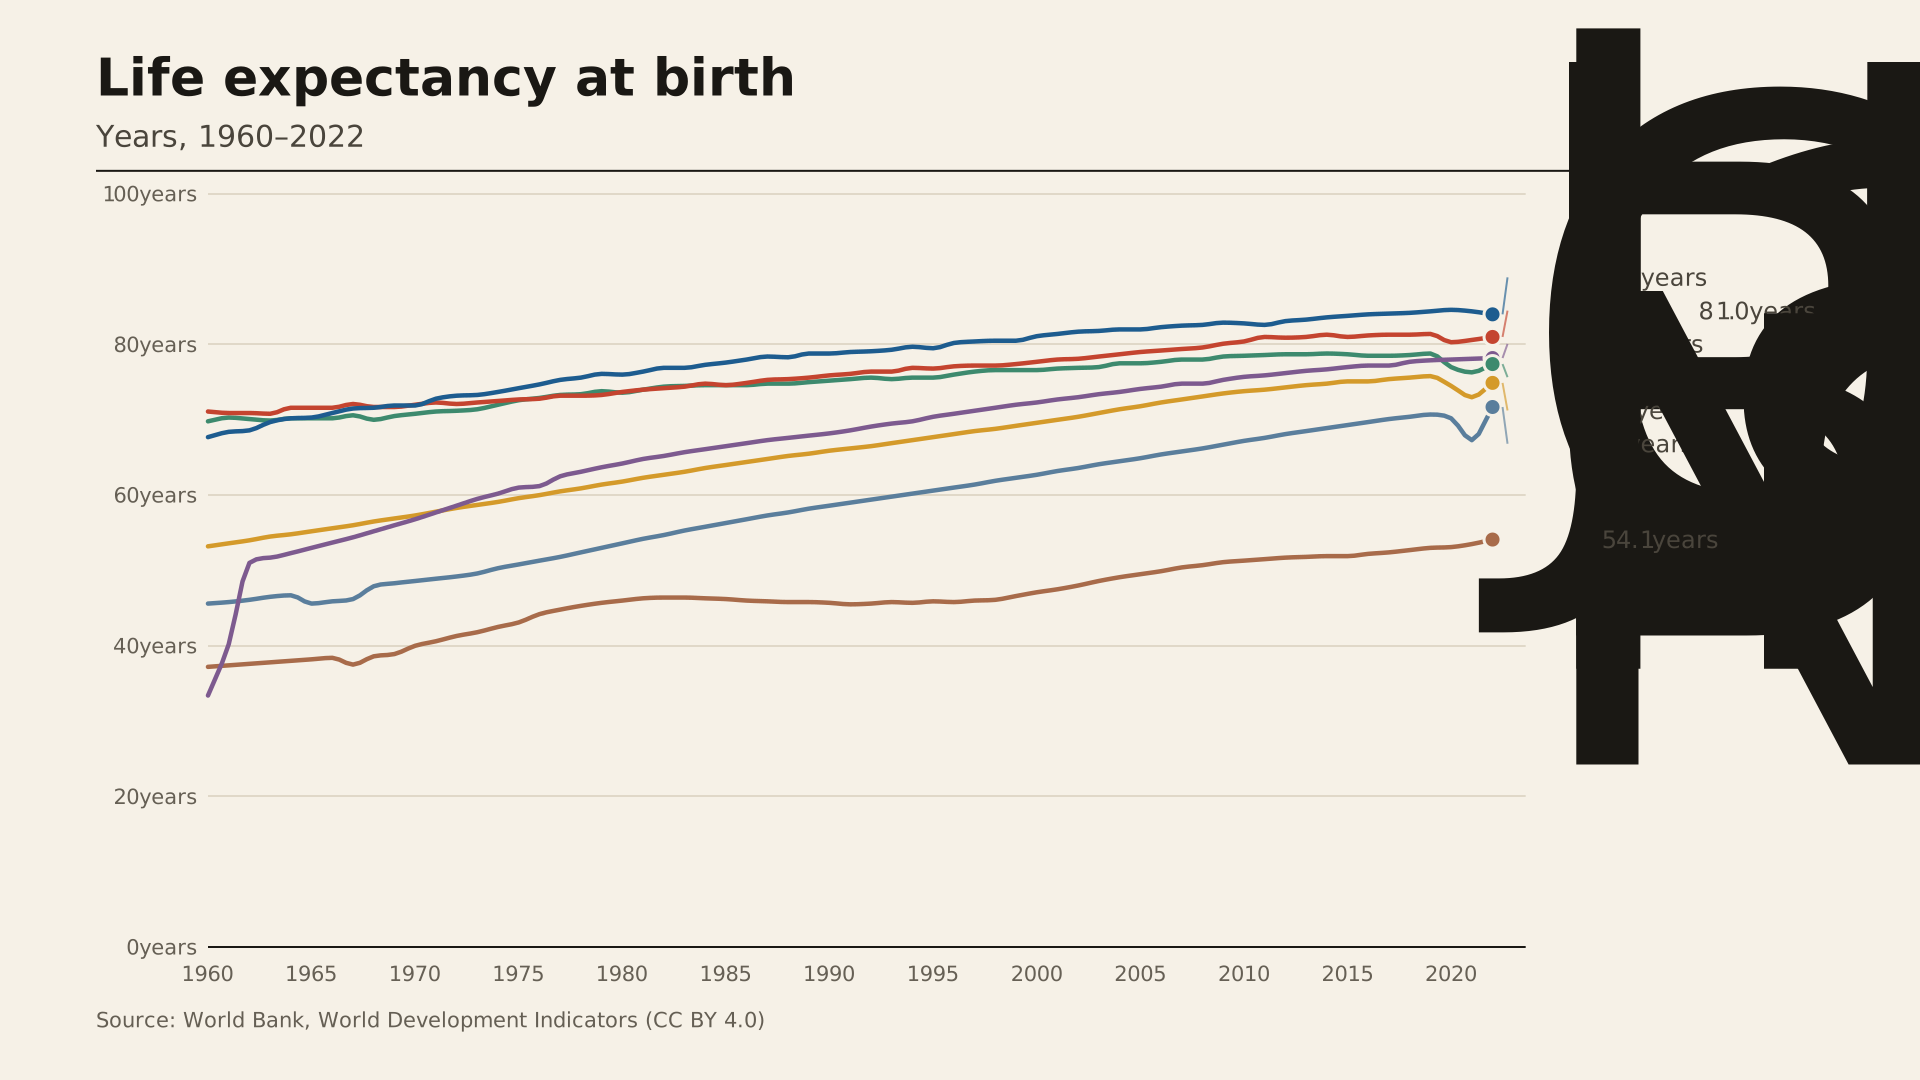
Life expectancy
Seven countries, 1960–2022, as lines
Line · 16:9 widescreen · World Bank data
Use the Life expectancy template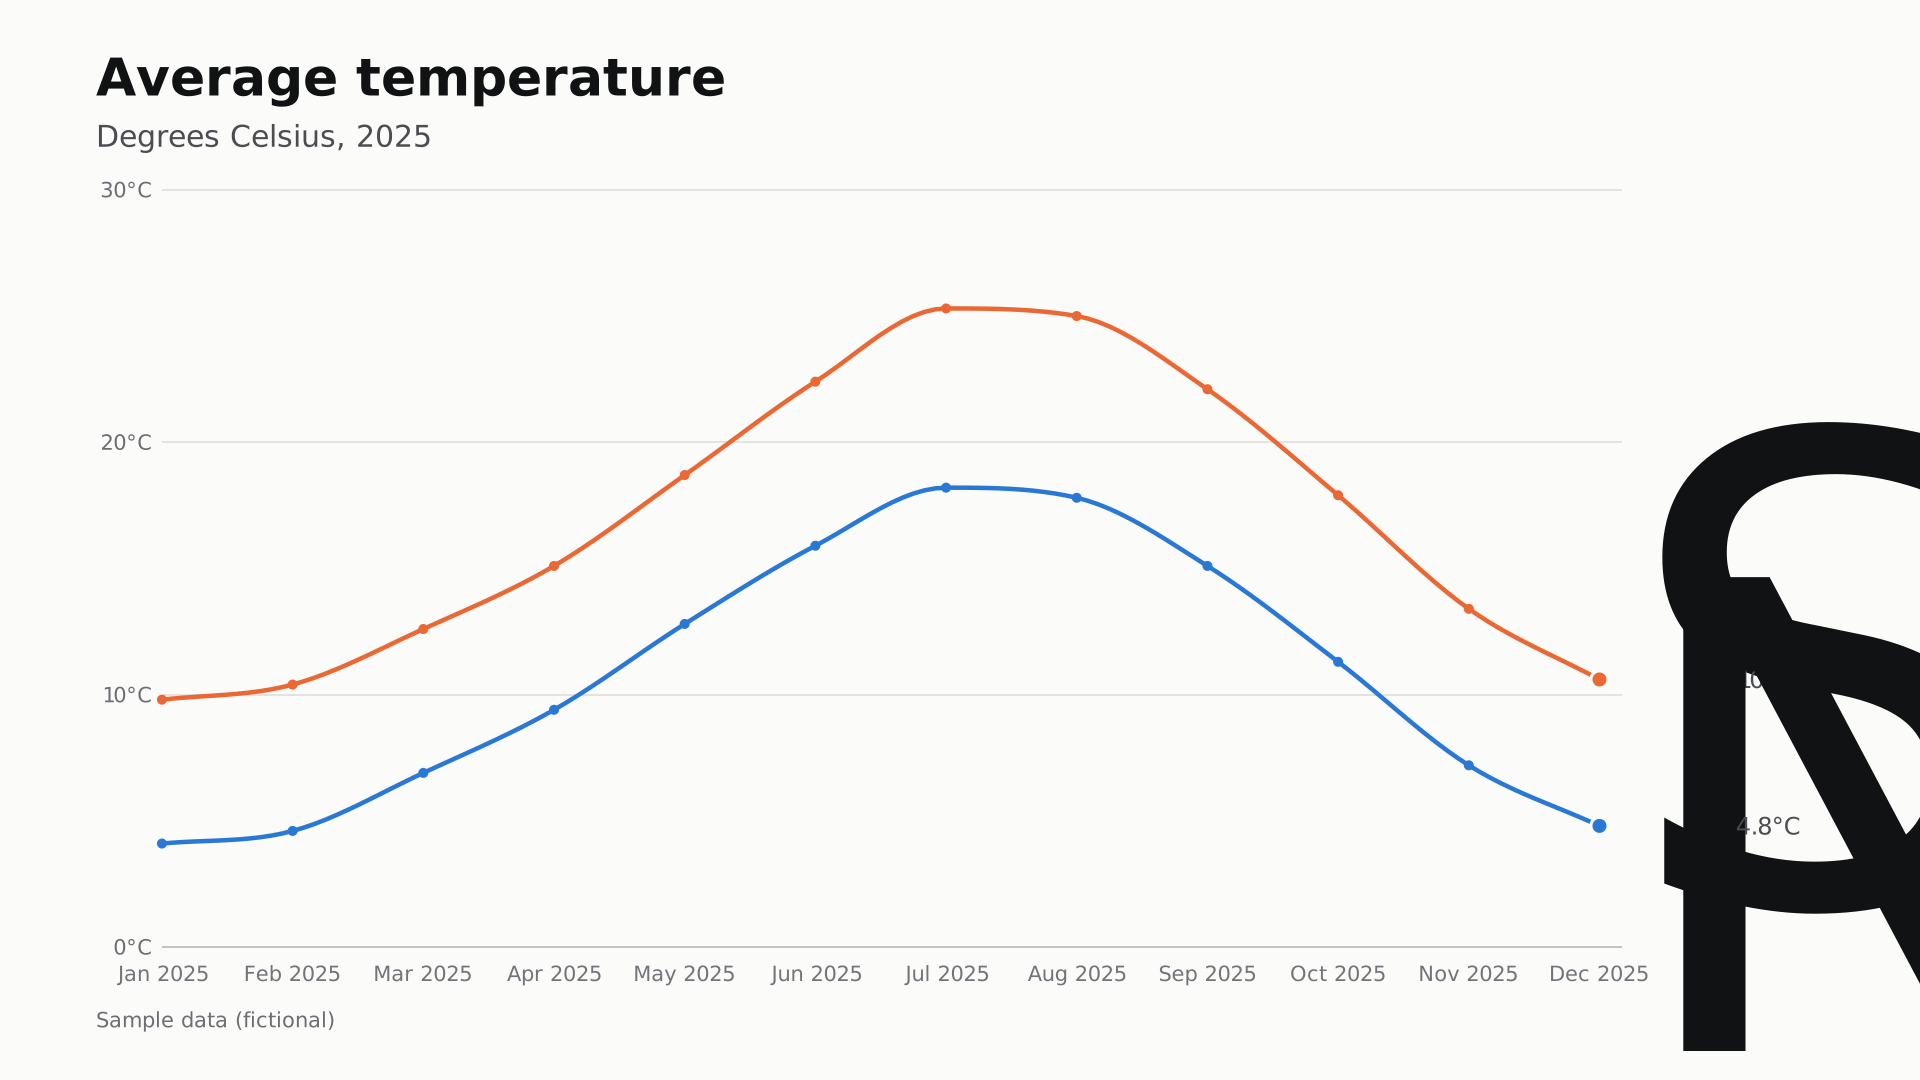
Monthly temperature
A two-line graph with a dot for every month
Line · 16:9 widescreen · Sample data
Use the Monthly temperature template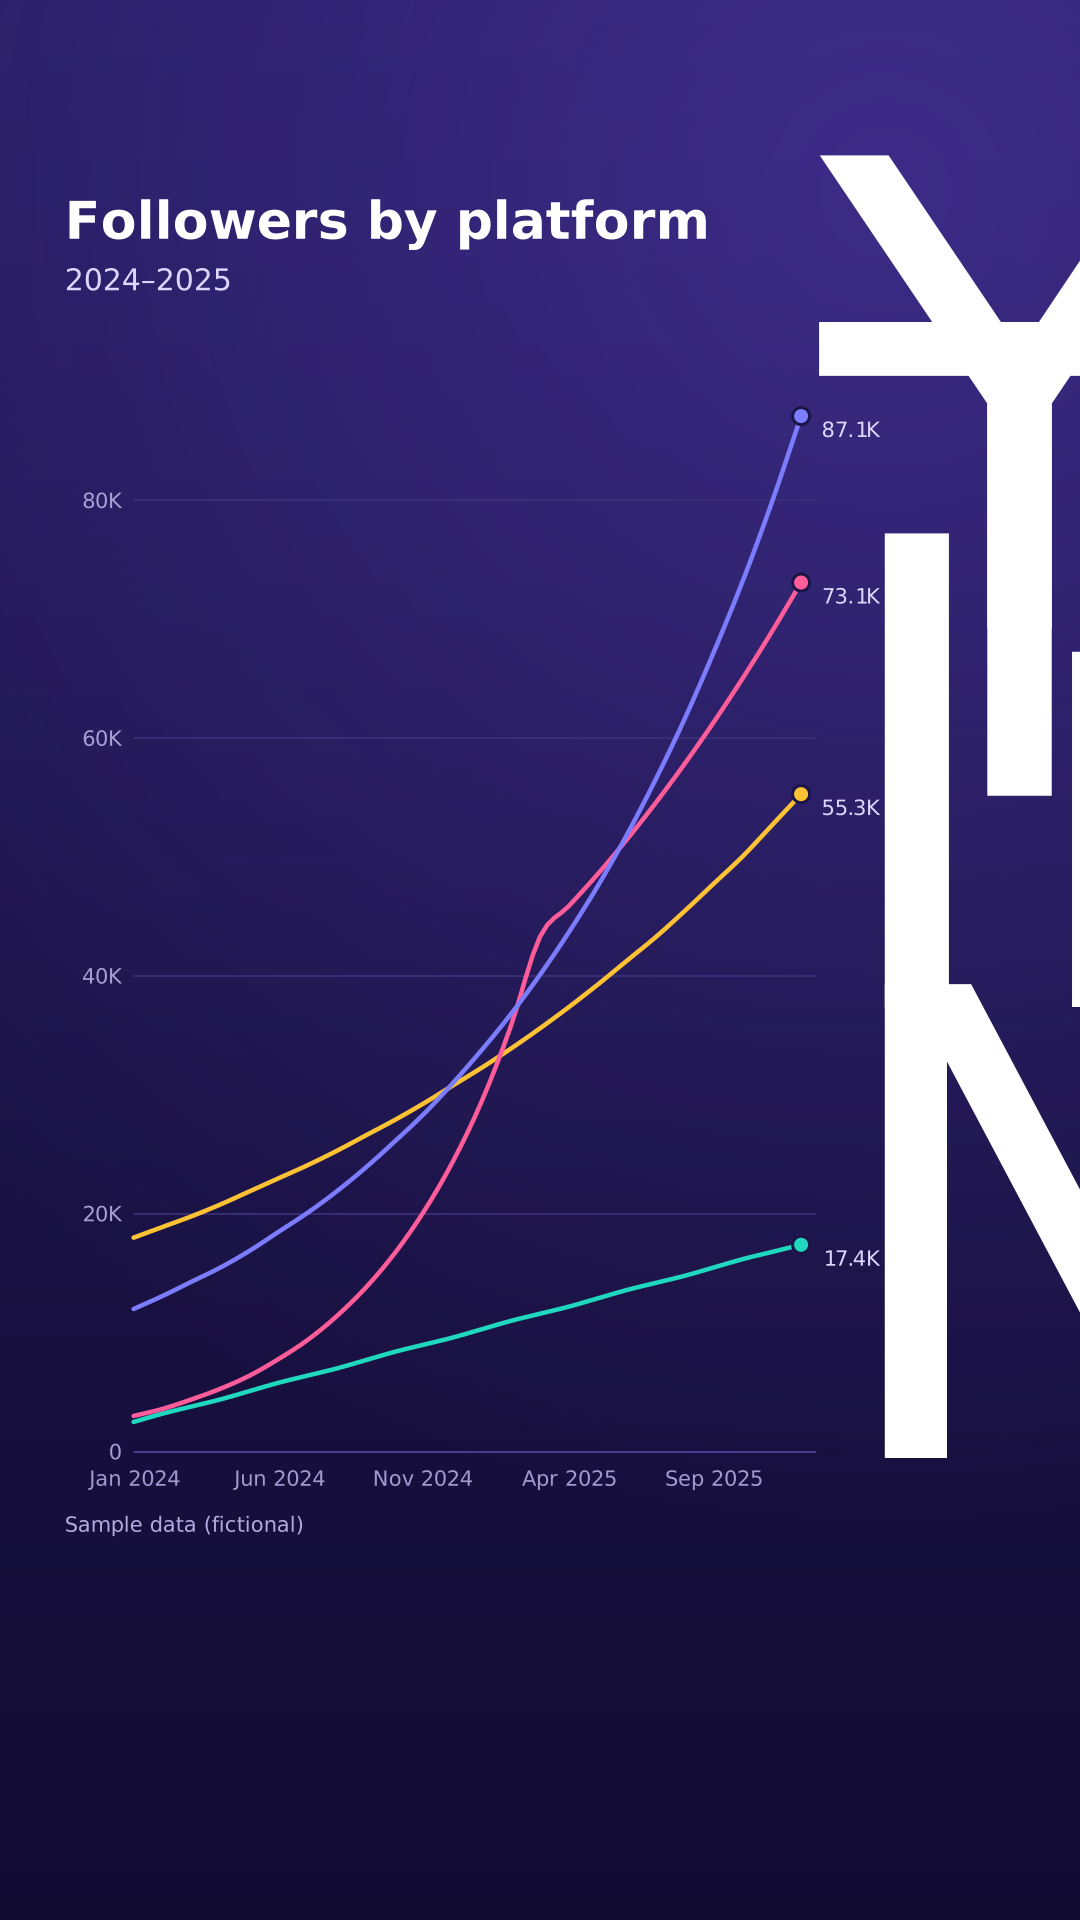
Social followers
A line race of followers by platform
Line · 9:16 vertical · Sample data
Use the Social followers template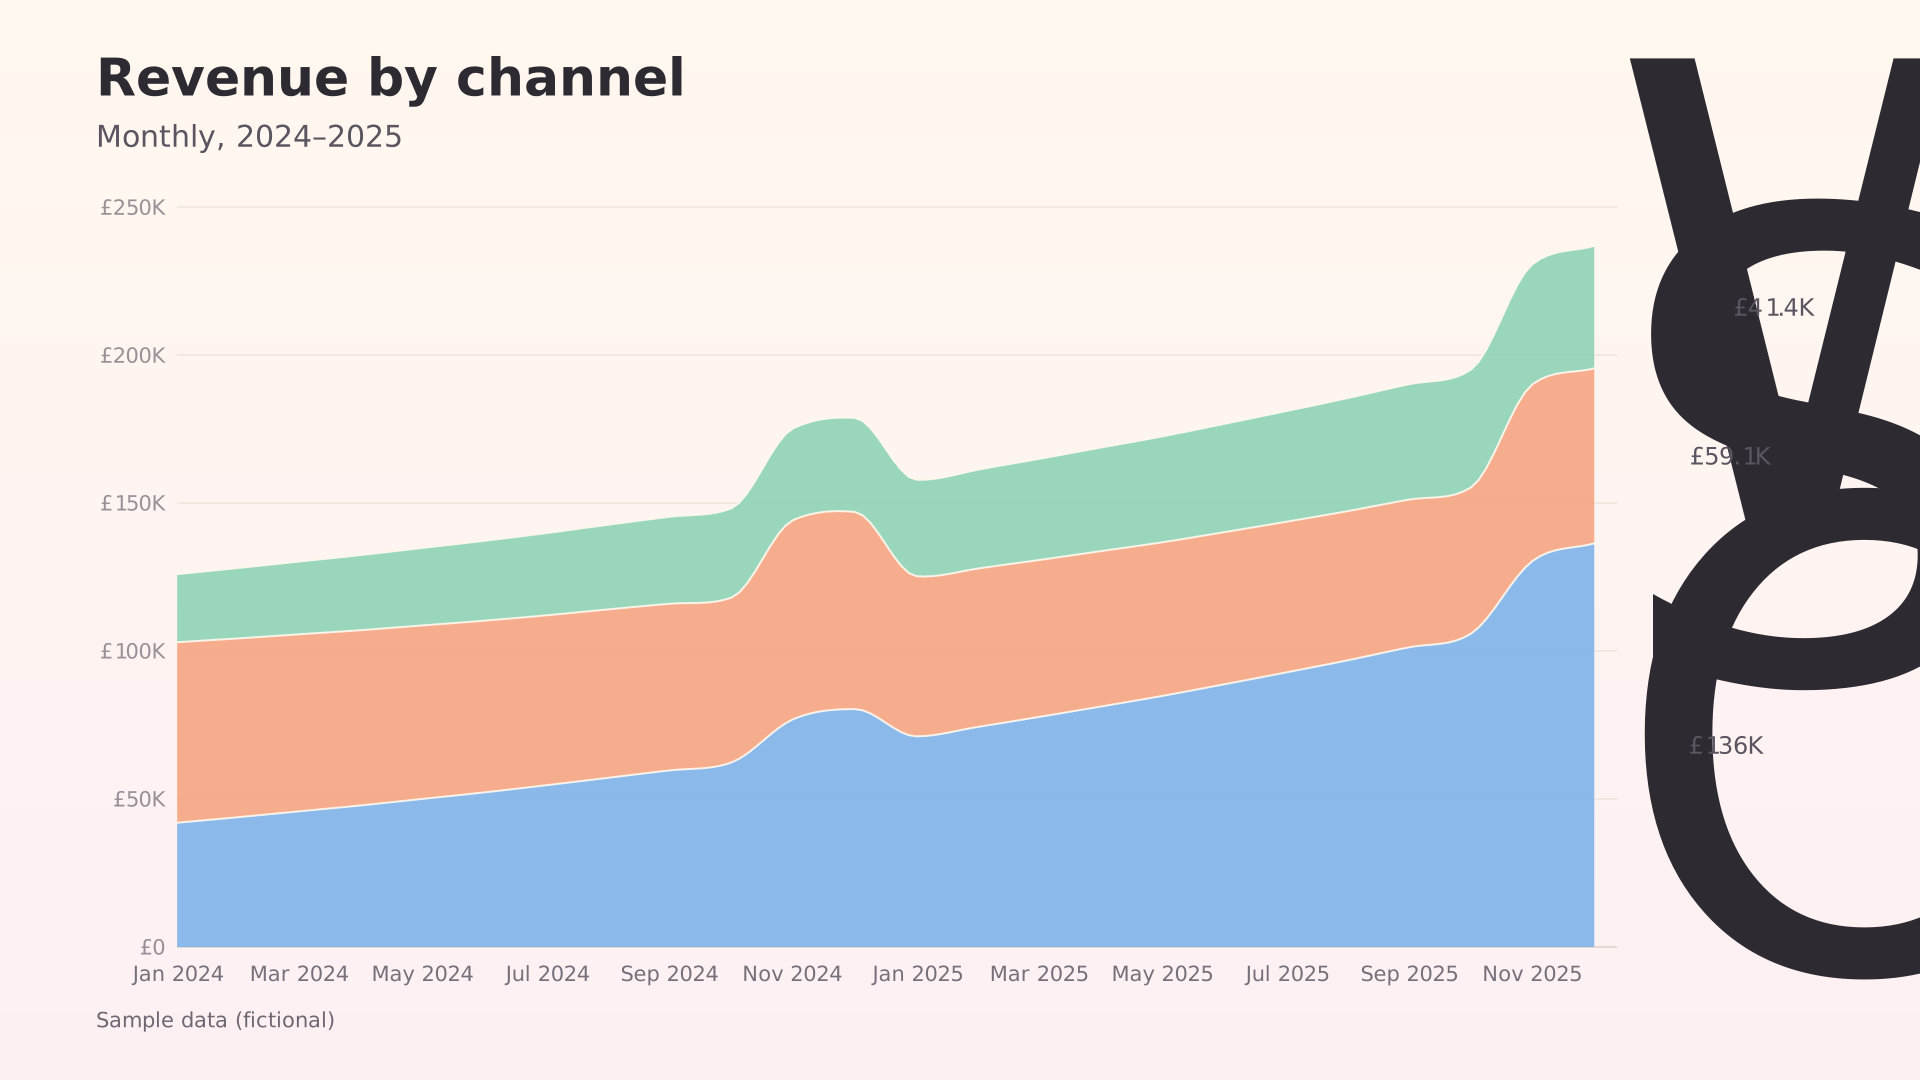
Sales by channel
A stacked area of three channels
Area · 16:9 widescreen · Sample data
Use the Sales by channel templateColumns that rise together or one by one, grouped side by side or stacked into totals.
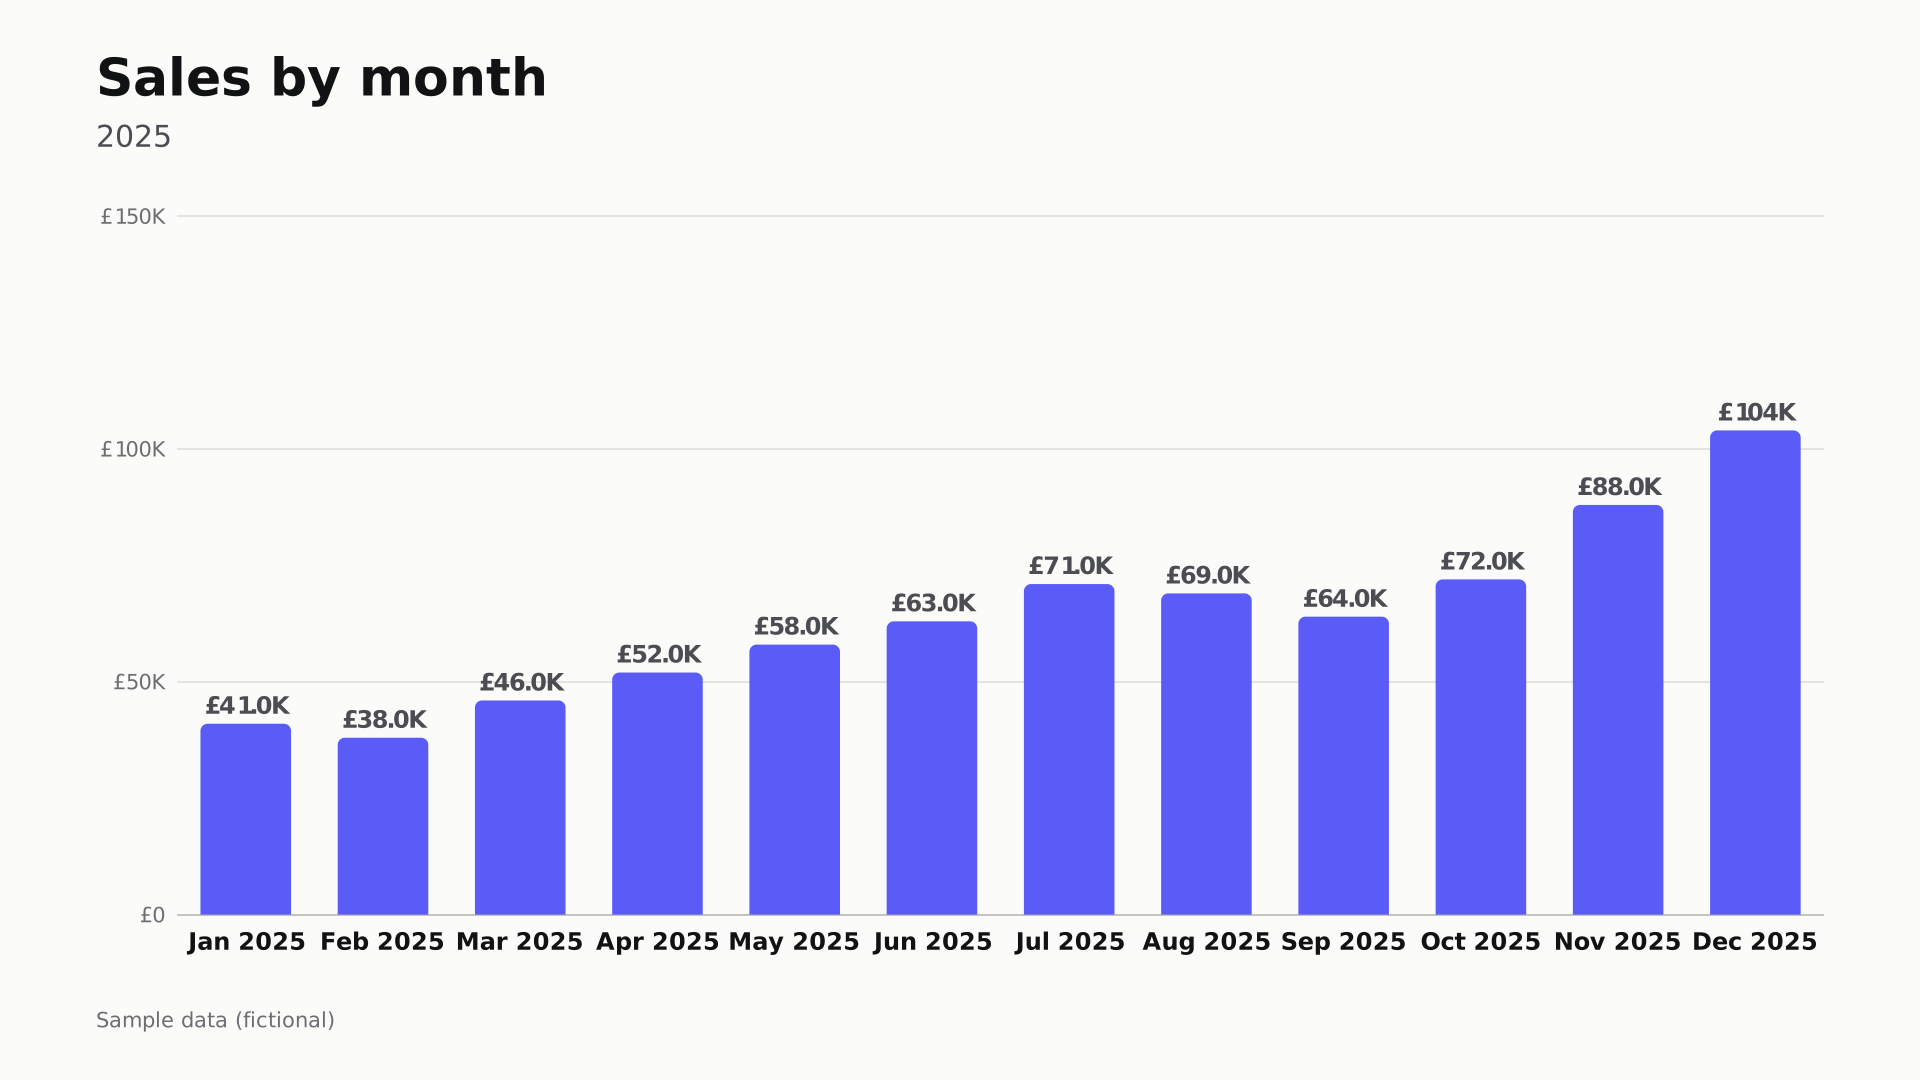
Monthly sales
Columns that rise one by one
Bars · 16:9 widescreen · Sample data
Use the Monthly sales template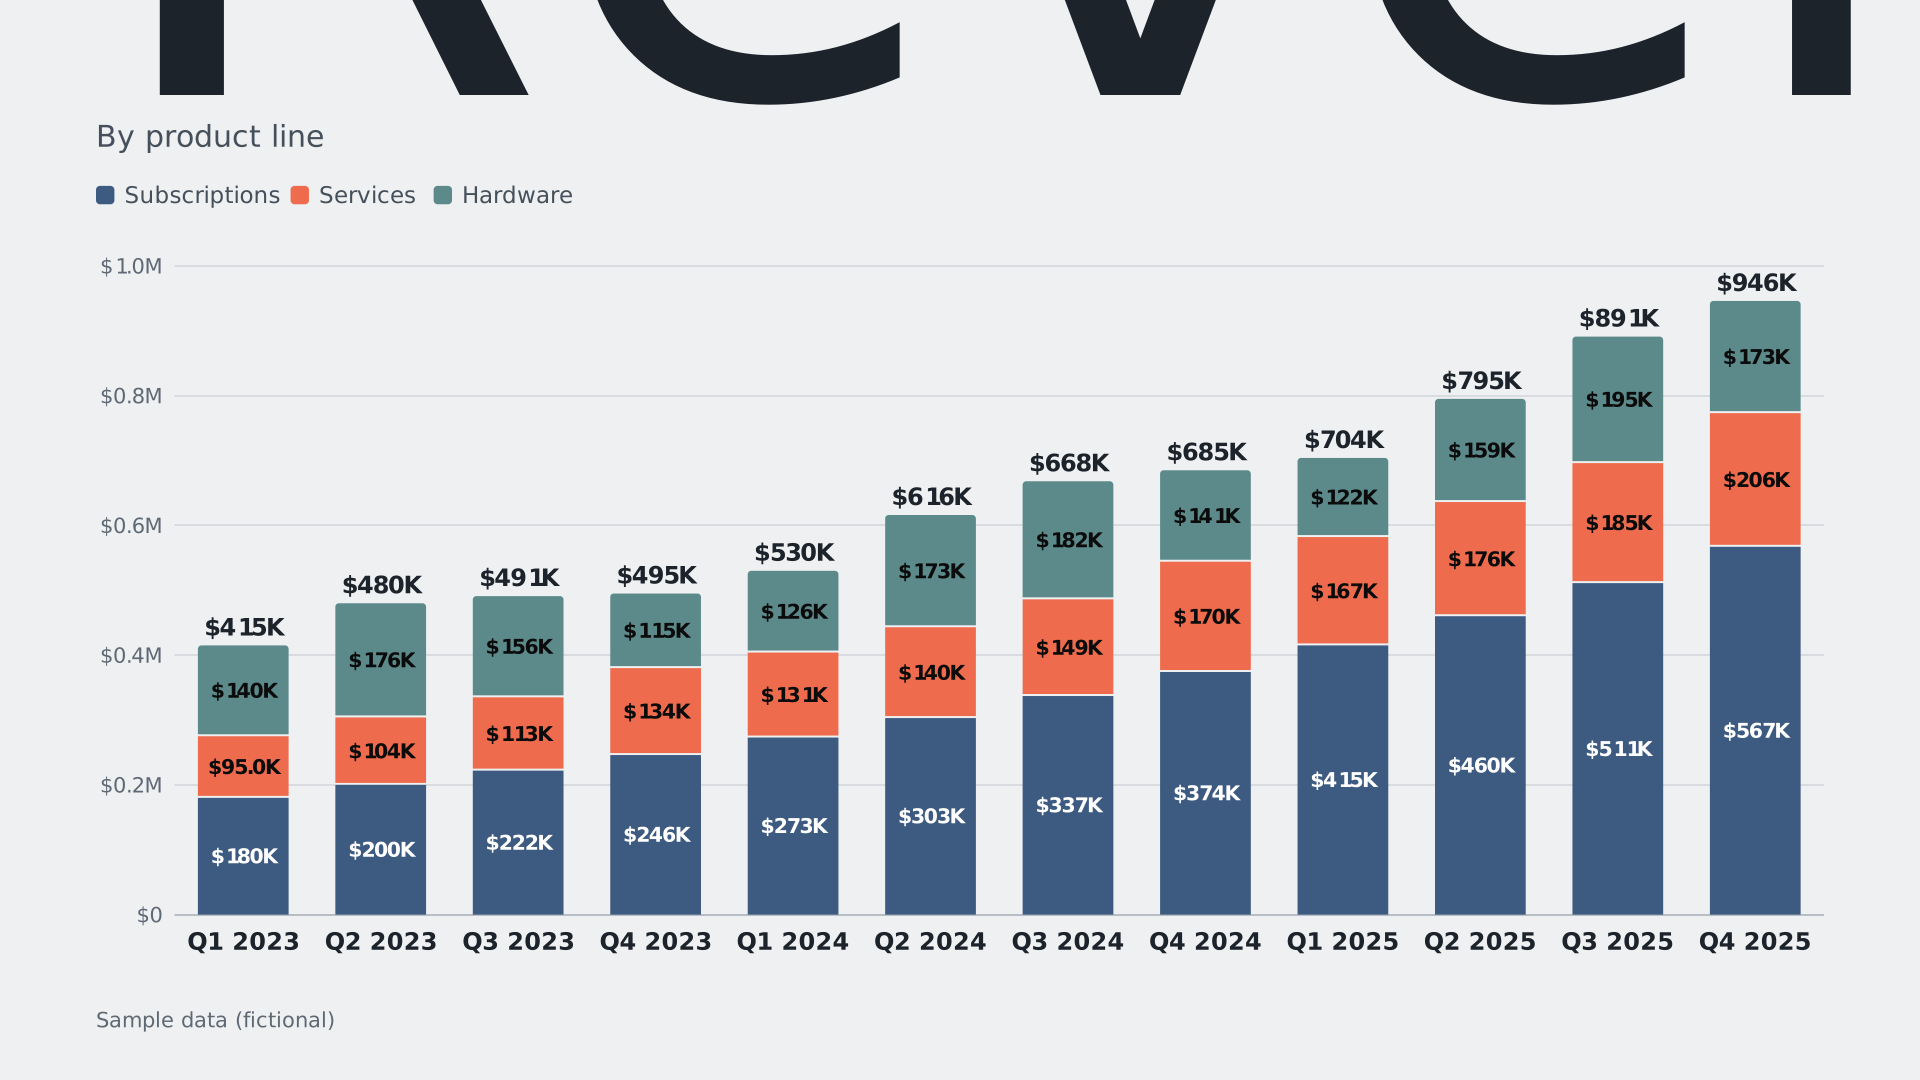
Revenue growth
Stacked quarterly revenue by product
Bars · 16:9 widescreen · Sample data
Use the Revenue growth template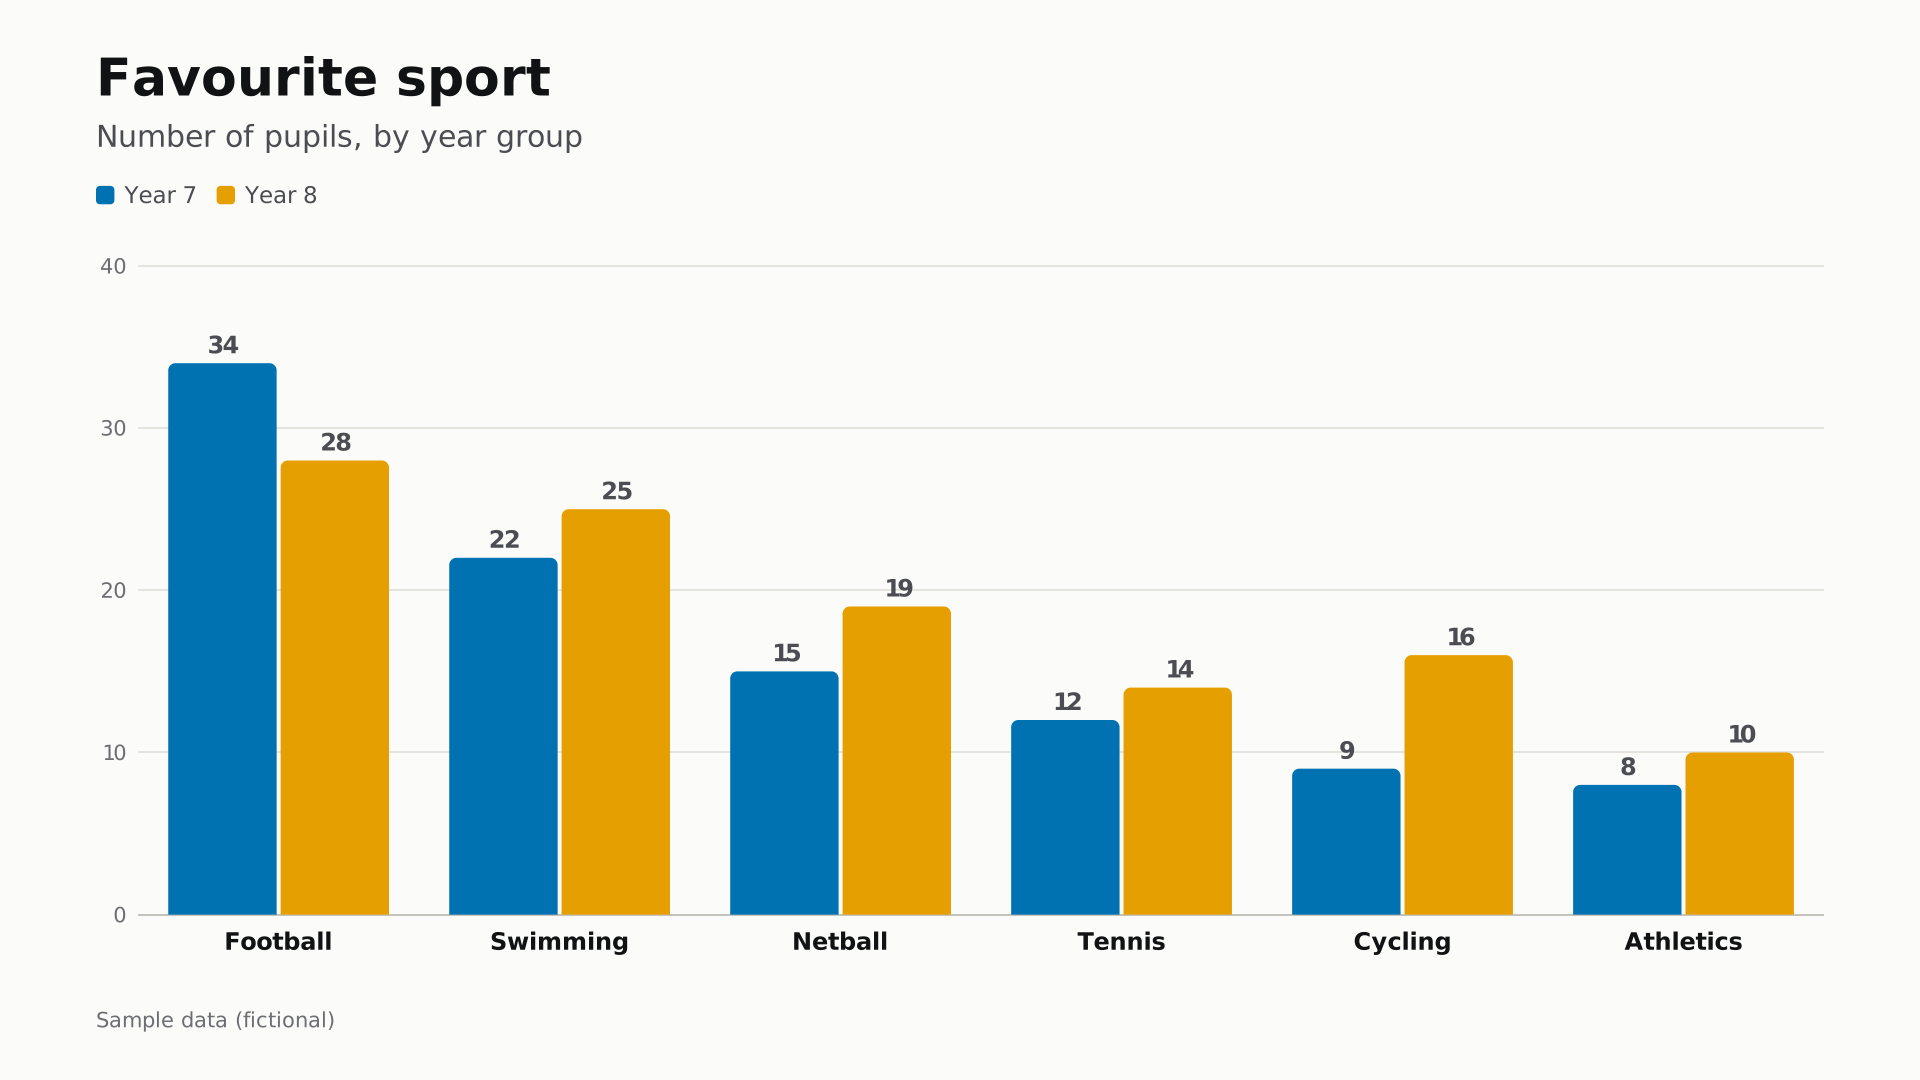
Class survey
A double bar graph of two year groups
Bars · 16:9 widescreen · Sample data
Use the Class survey template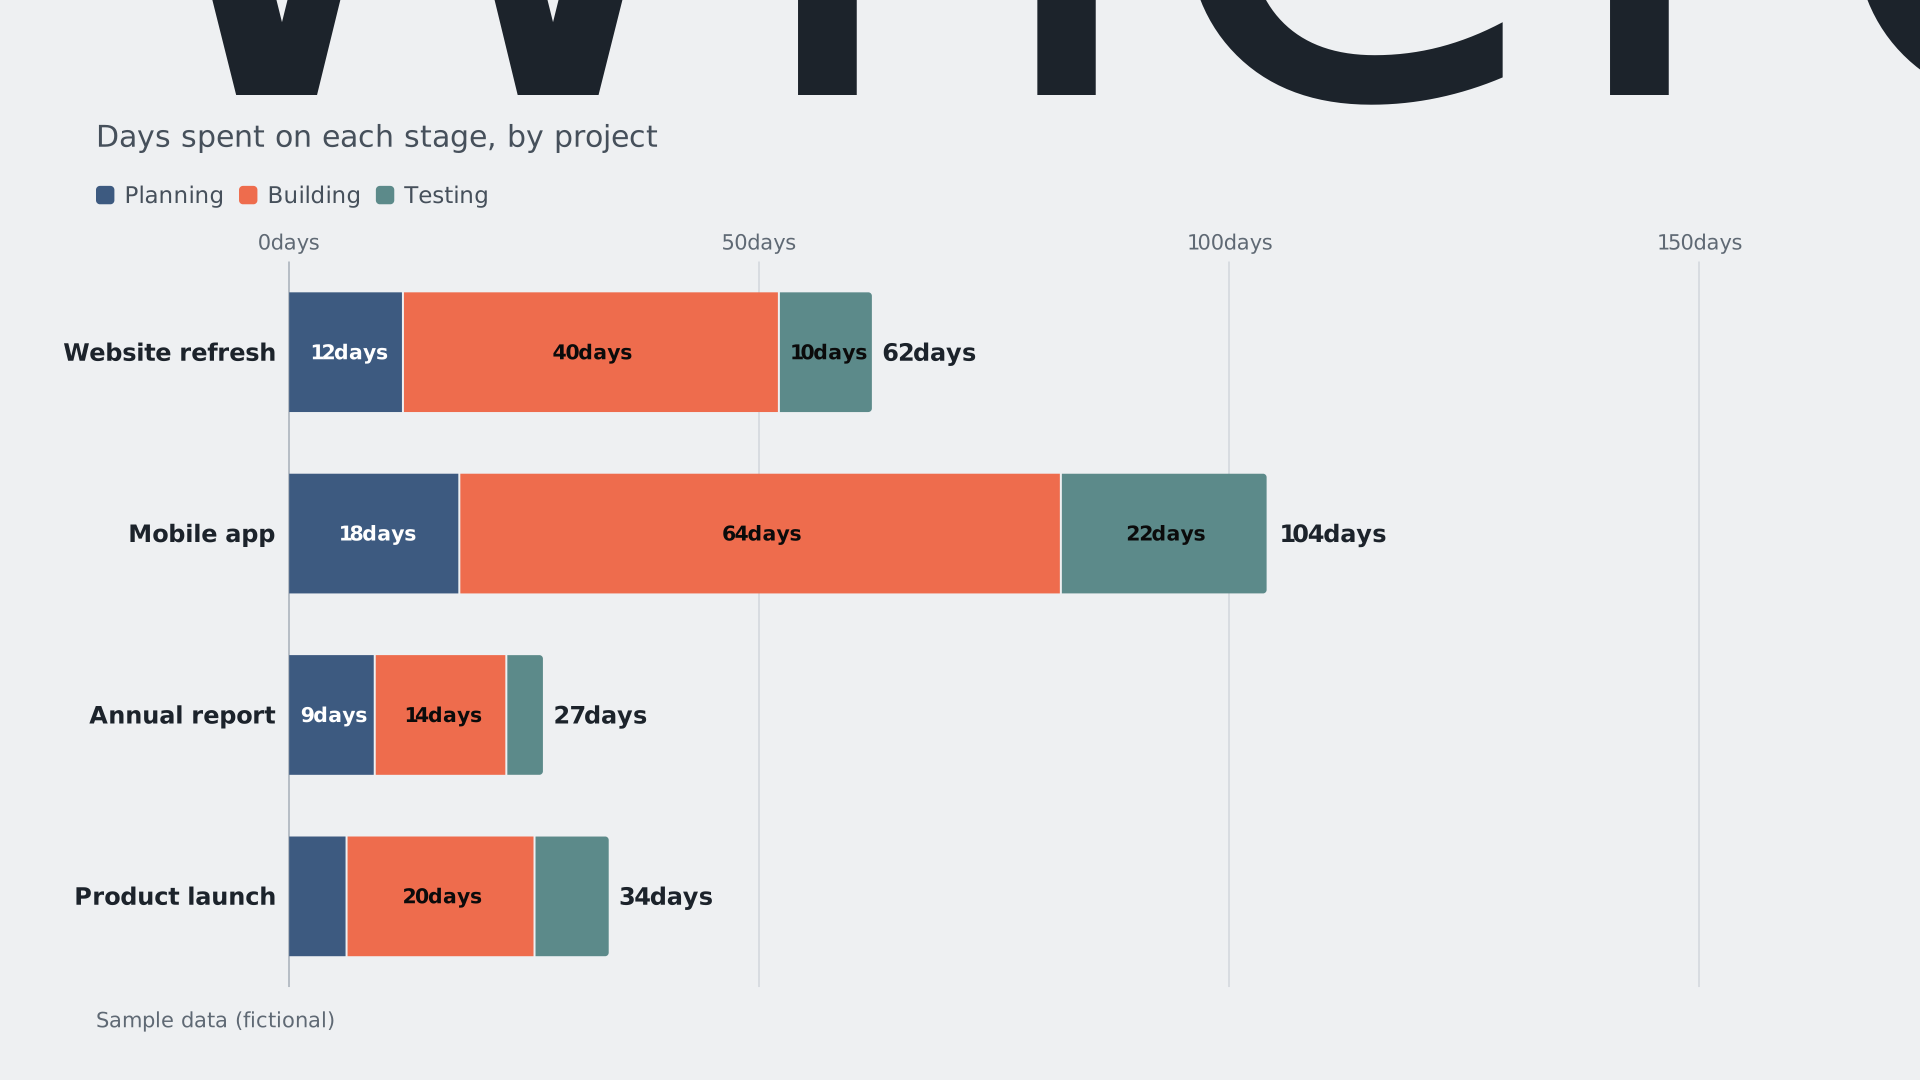
Project hours
Stacked (segmented) horizontal bars
Bars · 16:9 widescreen · Sample data
Use the Project hours templatePies, donuts, waffles and progress bars for budgets, survey answers and targets.
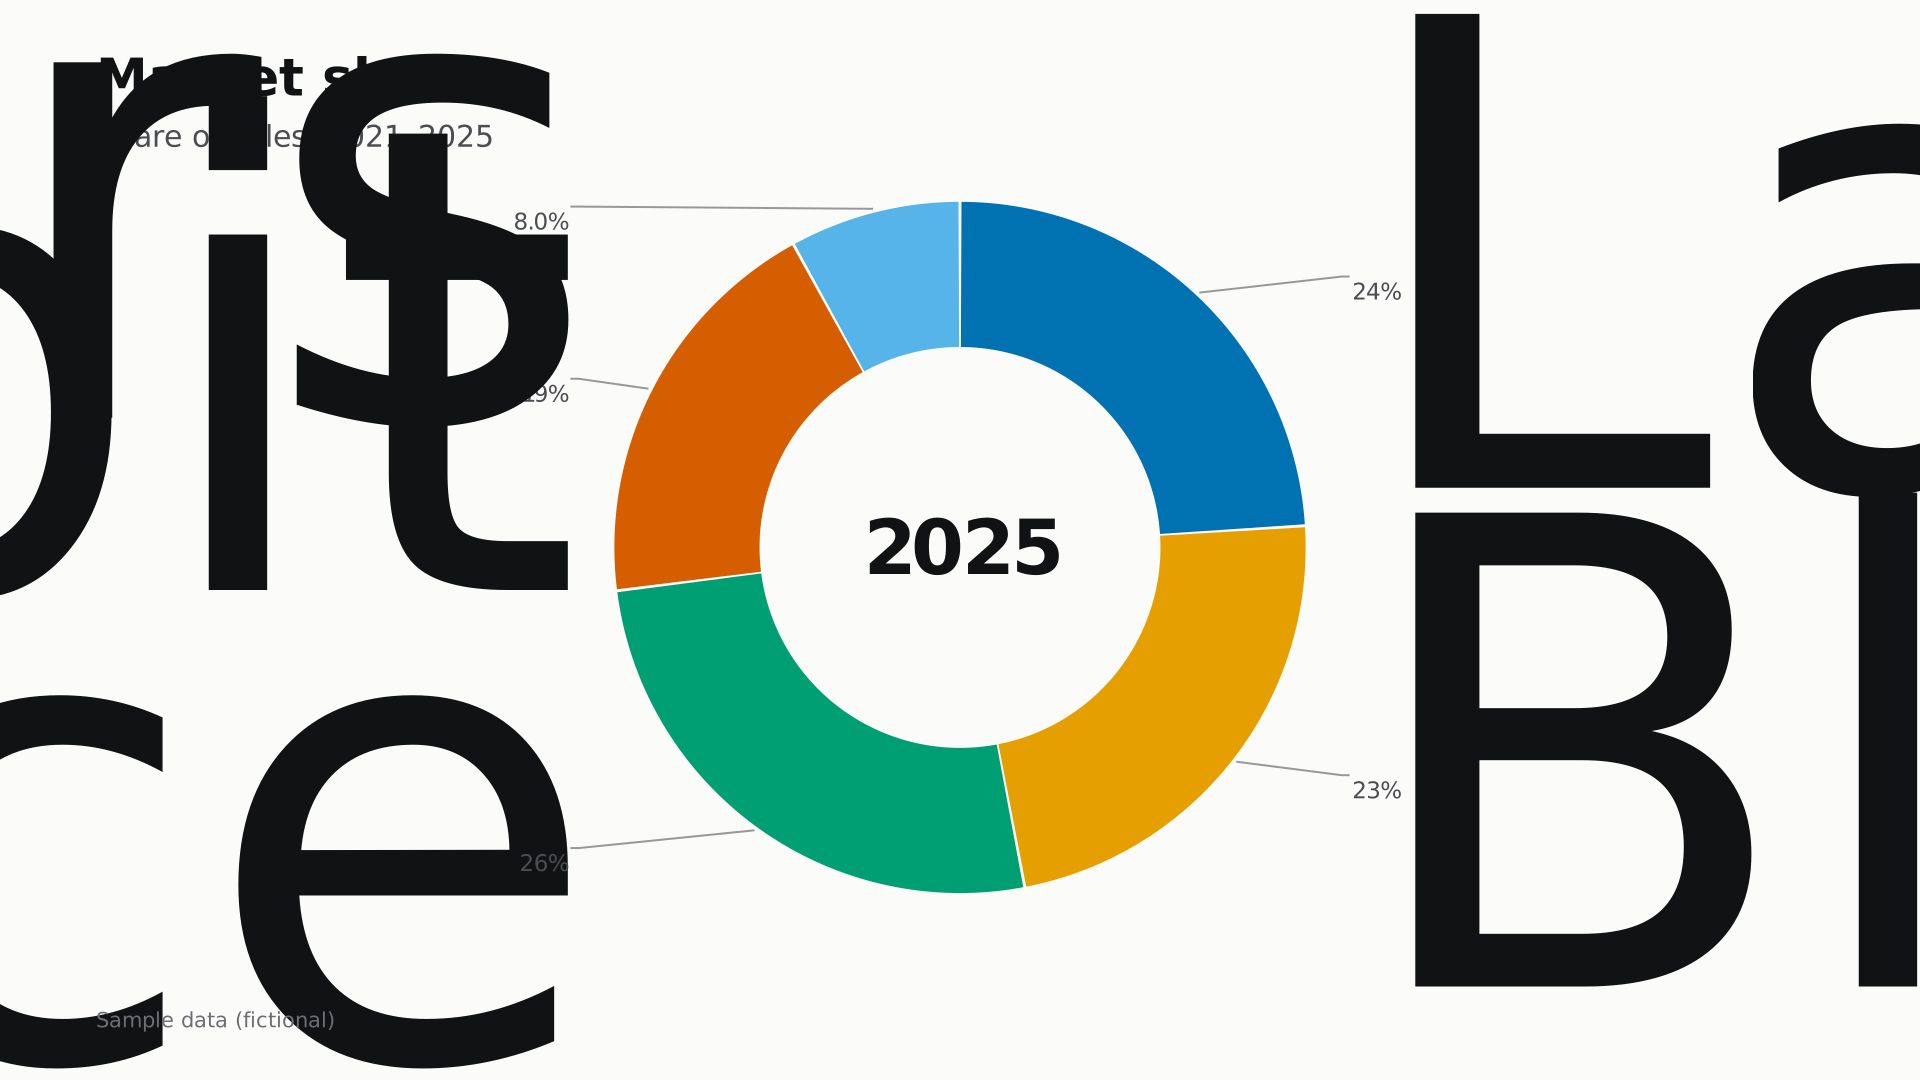
Market share
A donut that morphs year by year
Pie · 16:9 widescreen · Sample data
Use the Market share template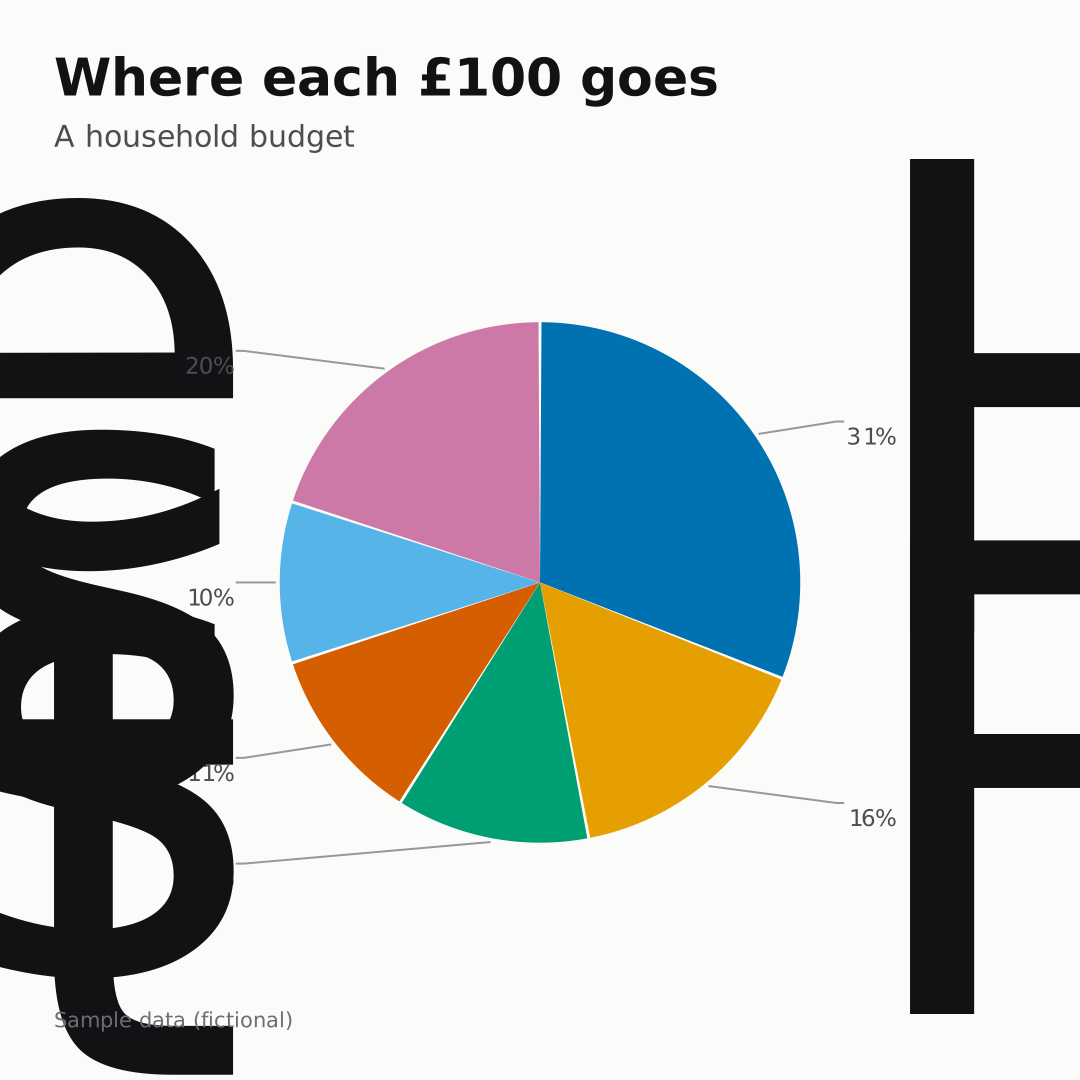
Budget pie
A pie chart with automatic percentages
Pie · 1:1 square · Sample data
Use the Budget pie template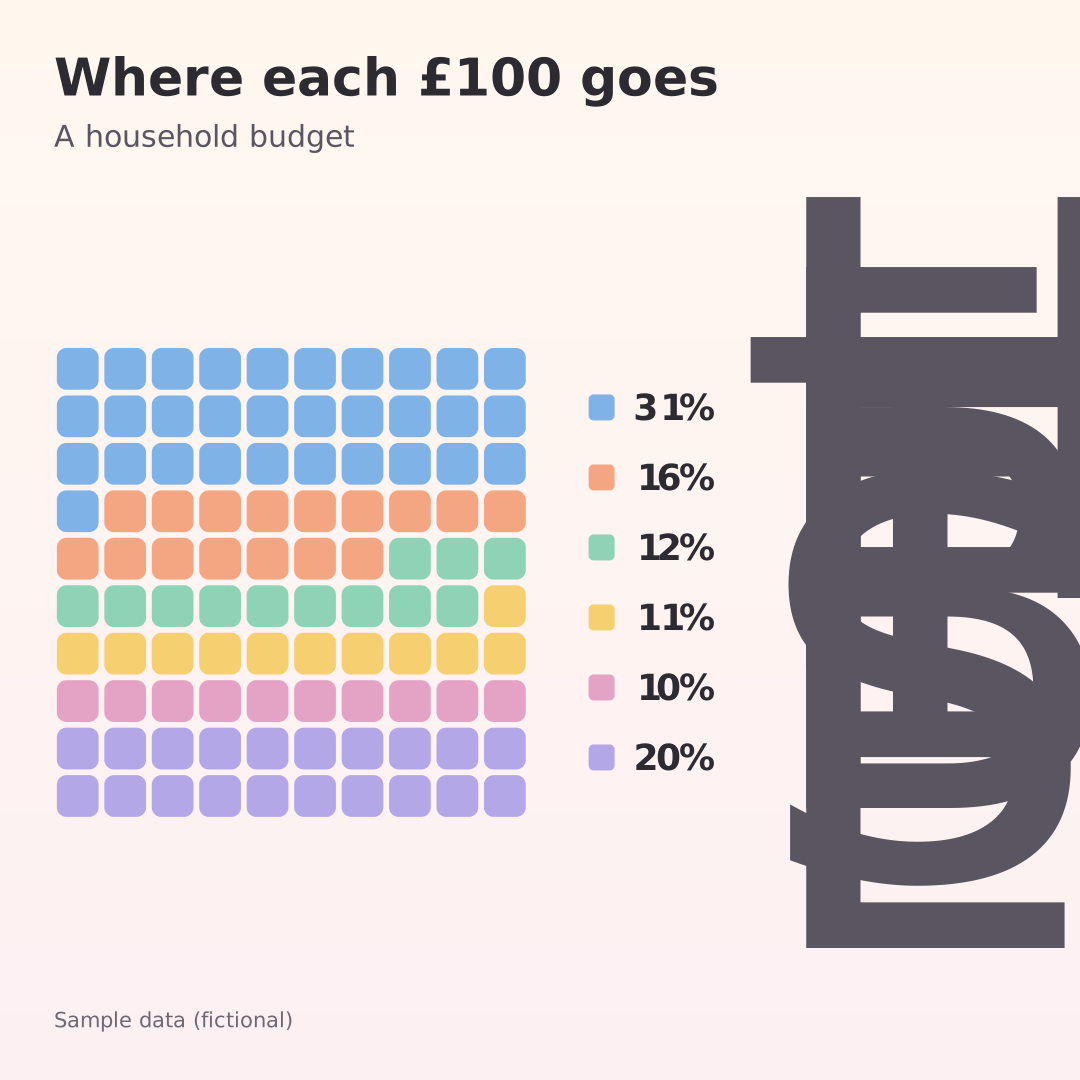
Budget waffle
100 squares, filled share by share
Waffle · 1:1 square · Sample data
Use the Budget waffle template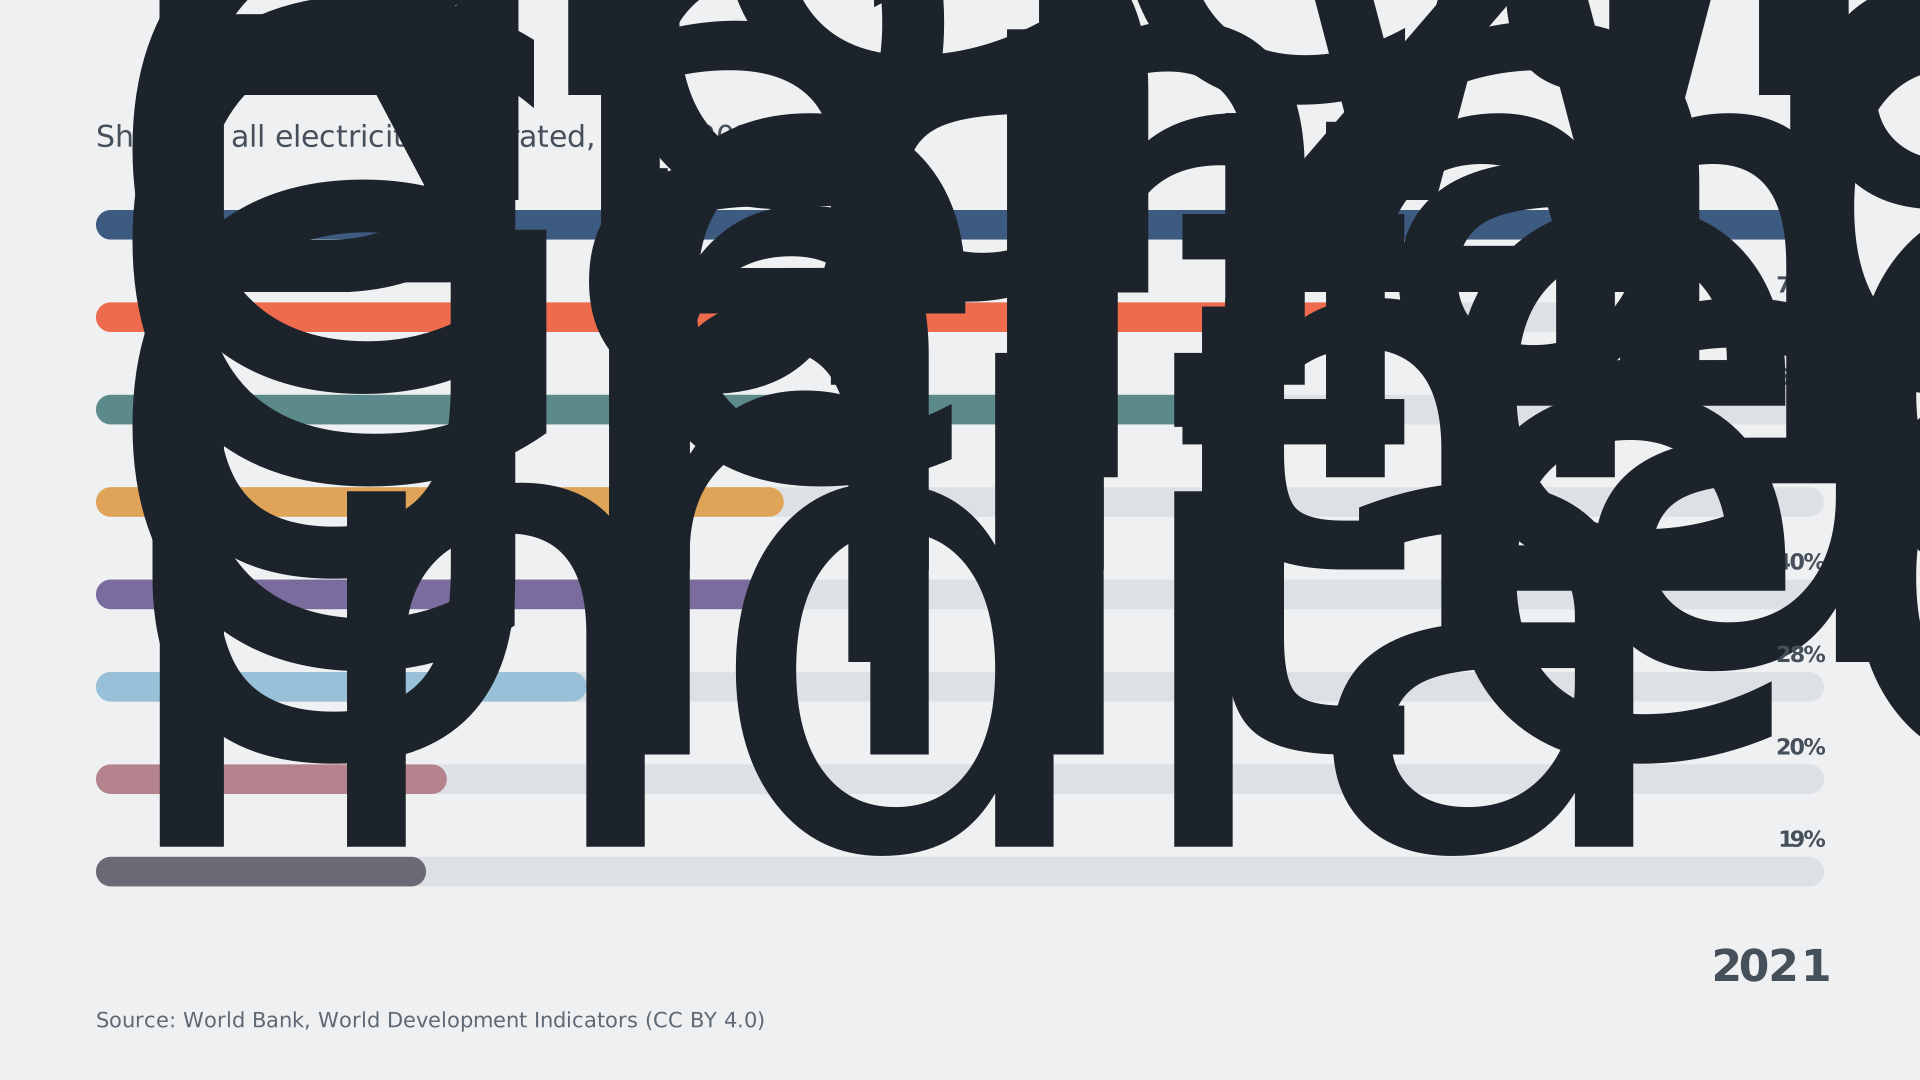
Renewables progress
Progress bars toward 100 %
Progress · 16:9 widescreen · World Bank data
Use the Renewables progress template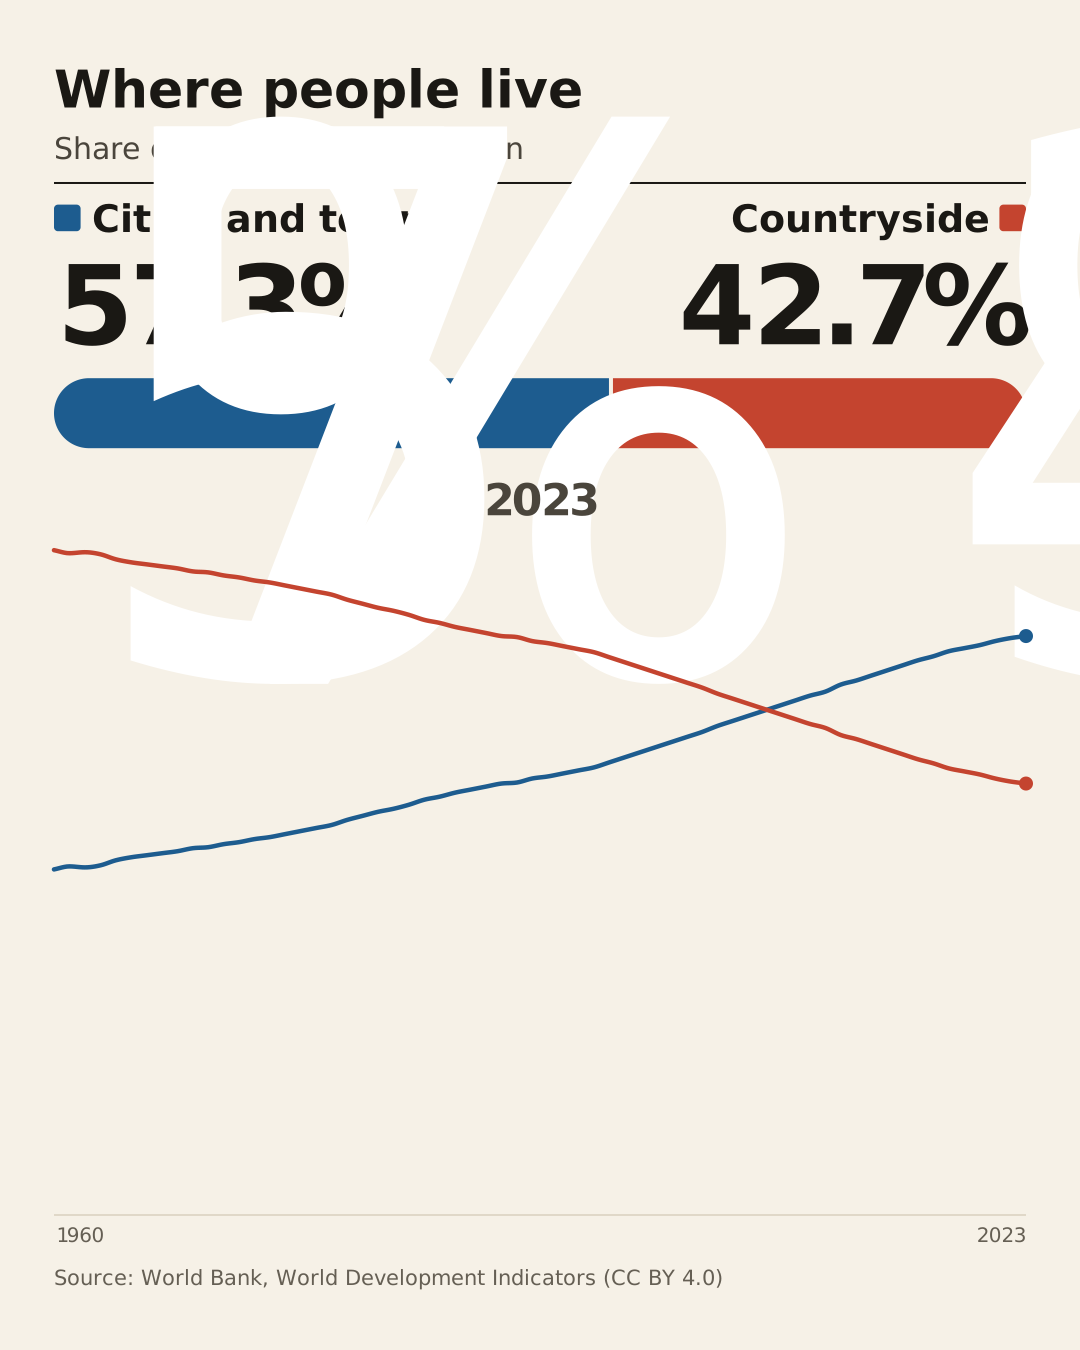
Cities vs countryside
A head-to-head that flips in 2007
A vs B · 4:5 portrait · World Bank data
Use the Cities vs countryside templateBig numbers that count up, with a sparkline; the overlay version has a transparent background for laying over footage.
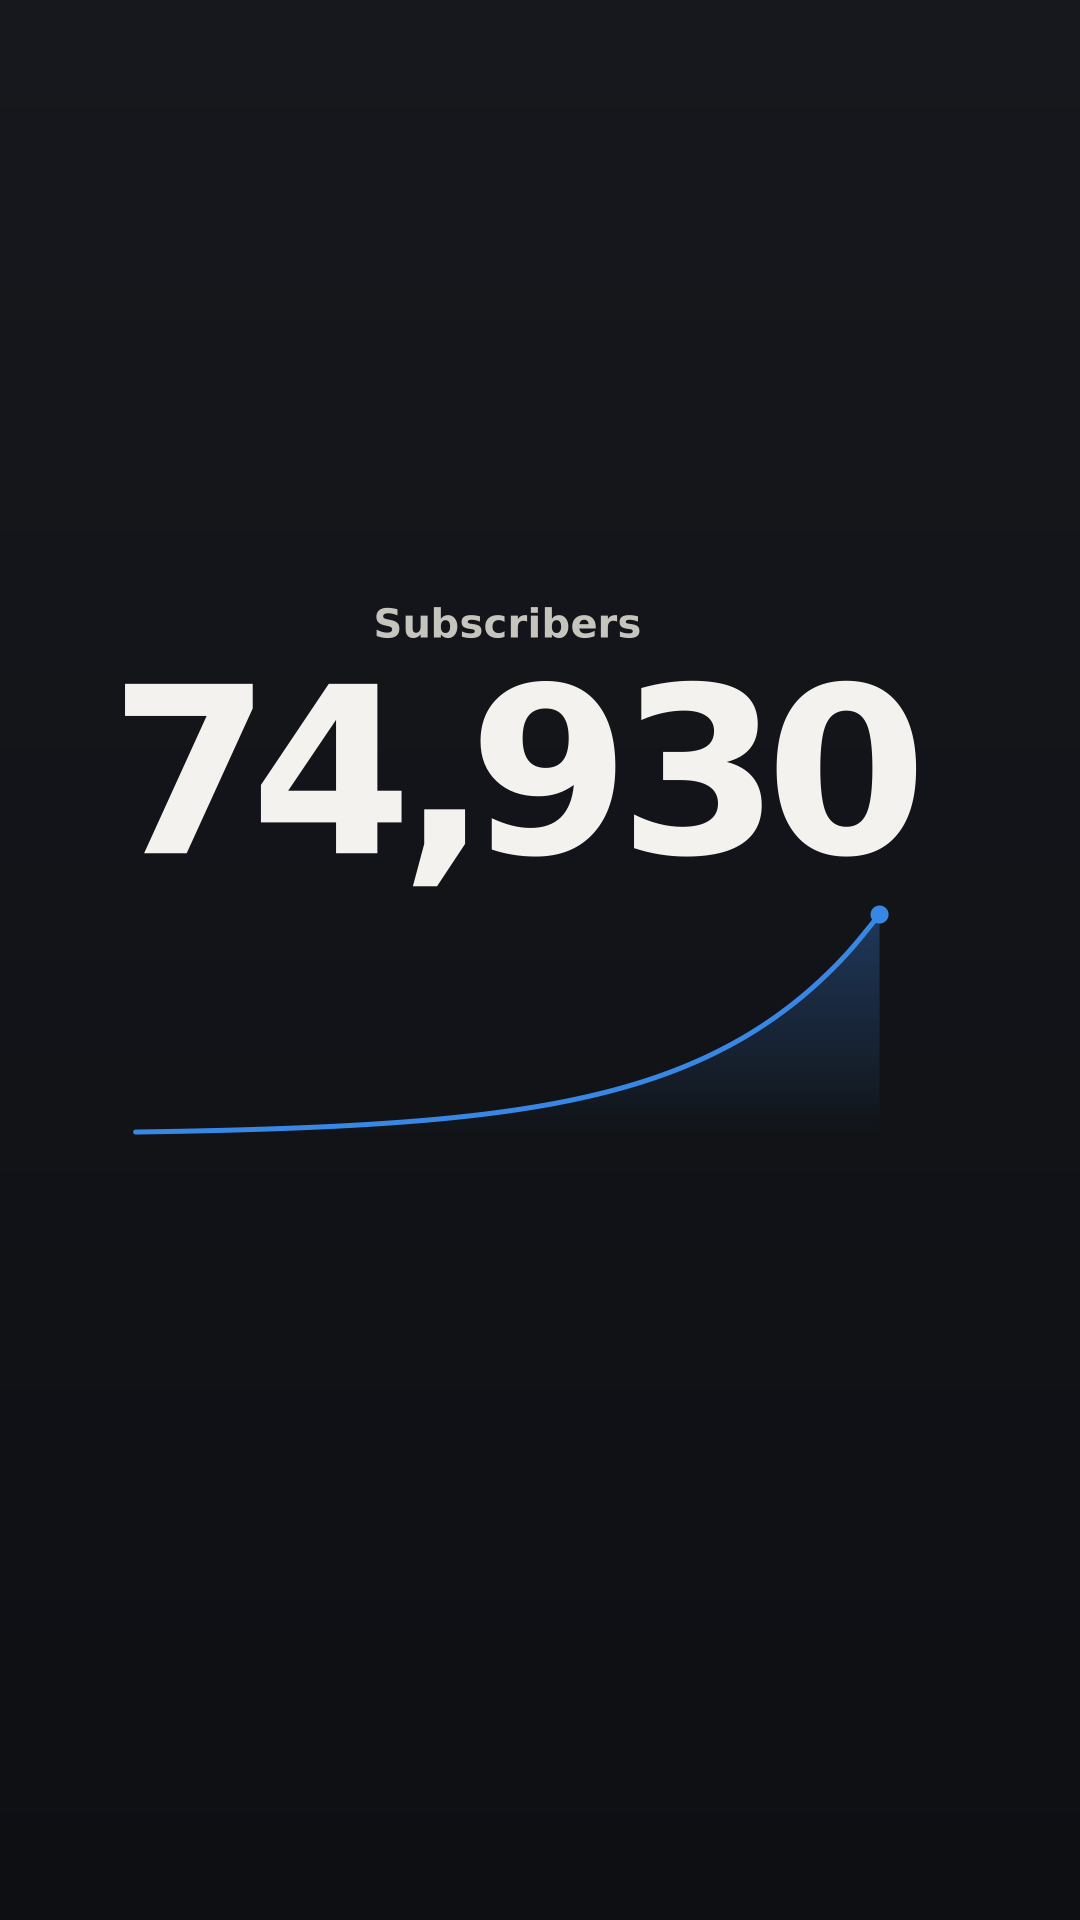
Subscriber counter
A milestone counter with a sparkline
Counter · 9:16 vertical · Sample data
Use the Subscriber counter template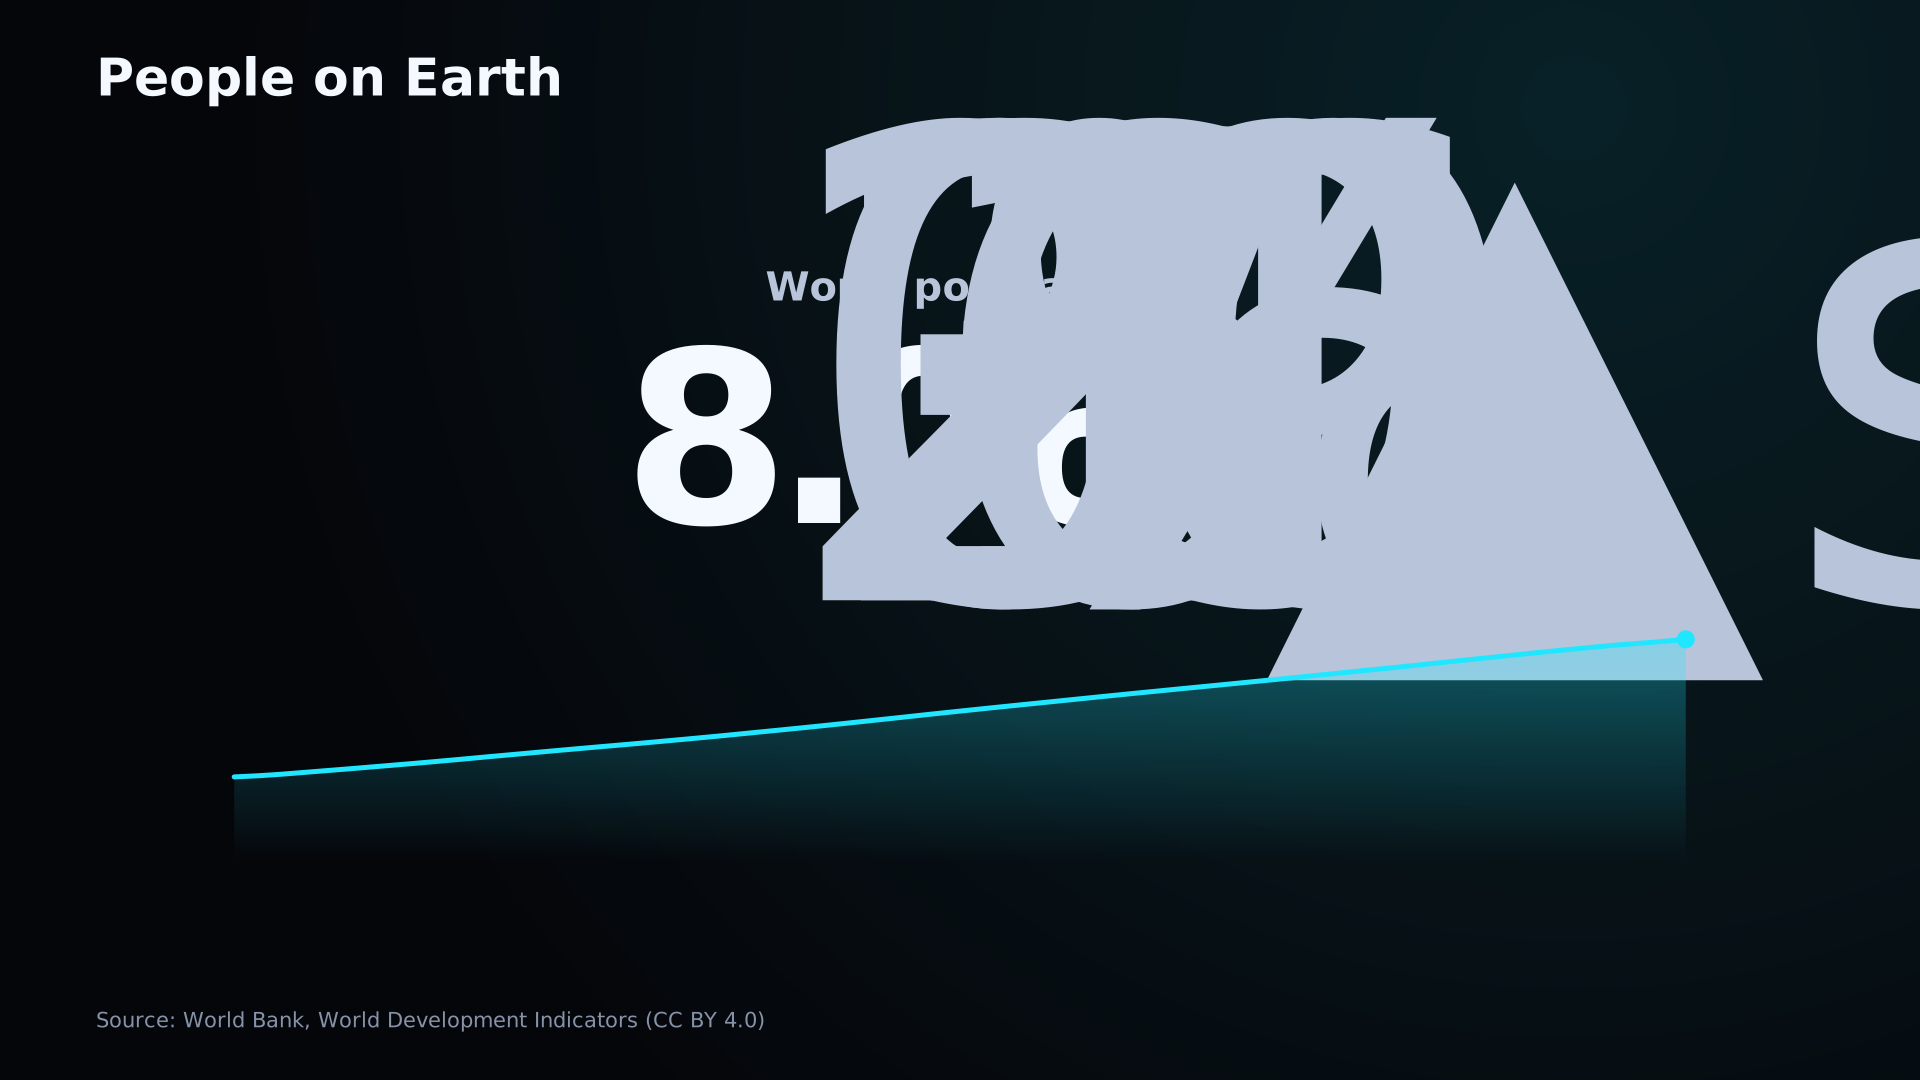
World population
A counter from 3 to 8 billion
Counter · 16:9 widescreen · World Bank data
Use the World population template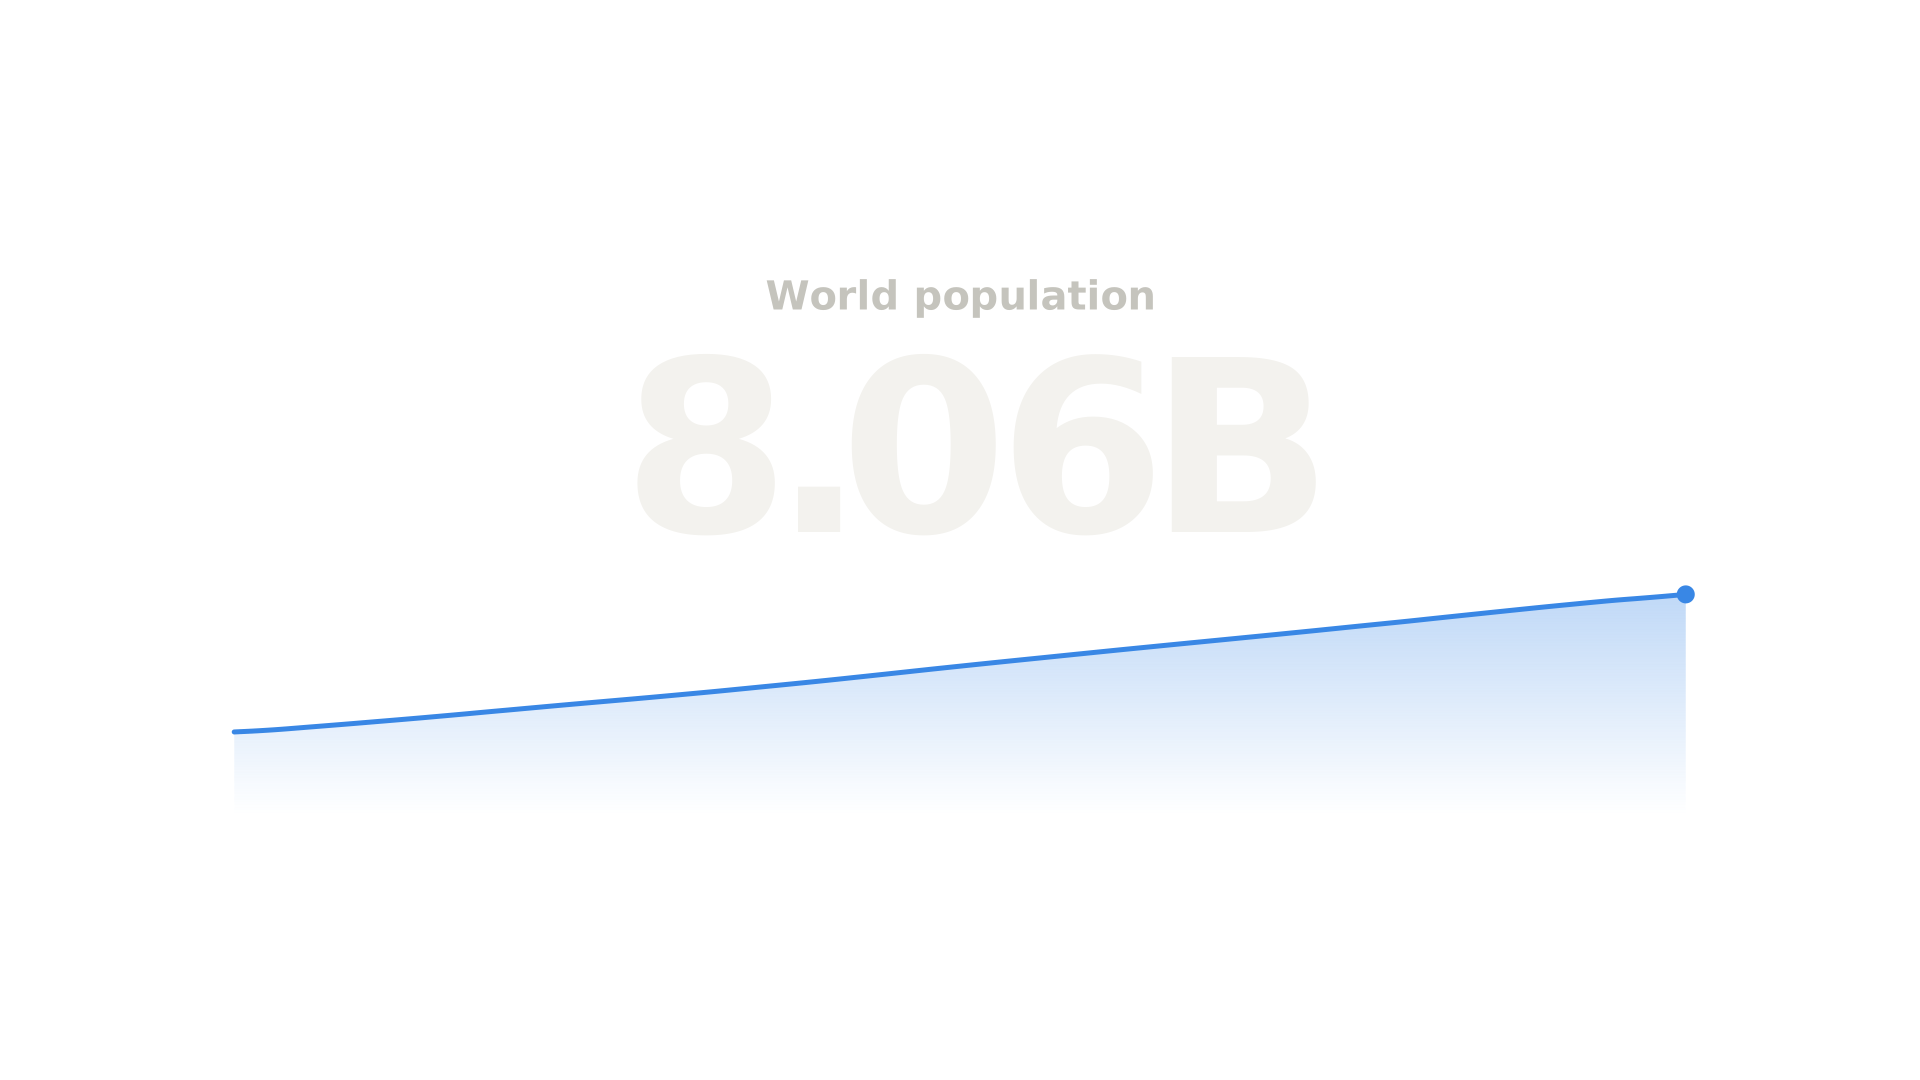
Counter overlay
A transparent counter to lay over footage
Counter · 16:9 widescreen · World Bank data
Use the Counter overlay templatePick one from the gallery and select Use the … template, or use Samples in the studio’s Data step at any time.
In Data, use Paste data, Open a file or Edit data. The template’s title and source are cleared so they don’t describe the wrong numbers.
Change the Look, colours, Title and your logo in Style, and the pace in Timing.
In Export, choose the file type and Format, then export and download.
Any template exports in any format, but some start in the shape their job needs.
Most “animated chart templates” are motion graphics with numbers typed into them: change the data and you redo the animation. These are driven by the data. Paste a longer table and the race gets longer; paste new values and the bars, axes and labels rescale and move on their own, with overtakes, counting numbers and labels that dodge each other worked out for every frame.
If you’re choosing between a template and building in another app, the overview of how to create animated charts compares this approach with PowerPoint, Excel, Canva and After Effects.
Yes, for anything, including commercial videos. Charts made from them are yours. Keep the World Bank credit in the source line if you keep their data.
Yes; that’s the point. Paste or open your table in the Data step and the template redraws with it.
Yes. Pick any chart in the Chart step; the data and the look carry over.
Yes. Choose 9:16 under Format in Export (or the format button in the studio’s top bar) for TikTok, Reels and Shorts.
Templates marked “World Bank data” use real World Development Indicators figures. The others use made-up numbers and say “Sample data” in their source line.