Can I make a donut chart instead?
Yes. In the Chart step choose Donut under Style. The centre shows the total, counting up as the chart sweeps in.
Free · runs in your browser · no sign-up
A pie or donut that sweeps in, then reshapes itself as the shares change from one period to the next, with labels and percentages that stay out of each other’s way.
An animated pie chart draws its slices around the circle, then (if your data has more than one period) morphs smoothly to the next set of shares. Open the Market share template below, which follows five fictional brands from 2021 to 2025, or choose Pie and paste your own parts.
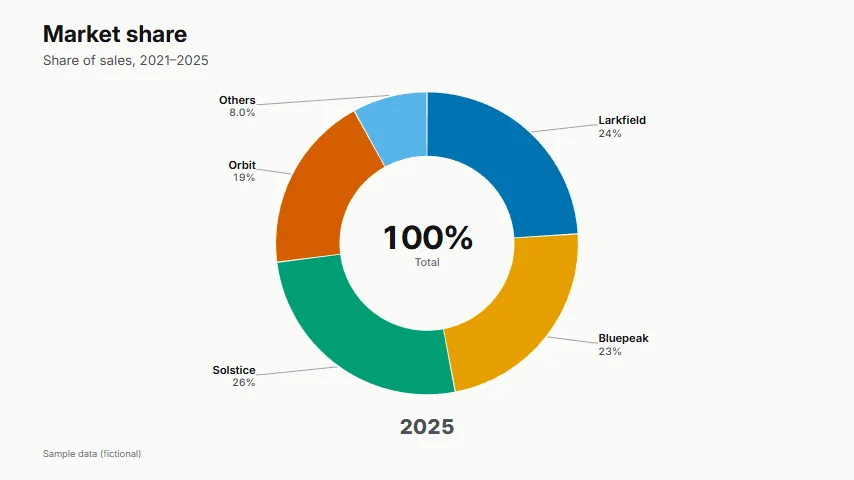
Slices keep their colour and their order while they grow and shrink, so viewers can follow one part through time. Labels sit outside the circle with leader lines and are spread out on each side so they never collide; slices under 1.5 % skip their label rather than cluttering the edge. A donut shows the total in its centre.
 (enlarge image)
A frame from a GIF export (Small, 480 pixels tall).
Select Open the Market share template, or choose Pie under Pick a chart to start.
In Data, use Paste data: names in the first column and values in the next. Add more columns (one per year) to make the pie morph.
In Chart, choose Donut or Pie under Style, and turn Value labels on or off under More options.
In Export, choose Video (MP4) or GIF, the Format, and export.
Pies work for a handful of parts of one whole. With more than eight slices, the smallest are grouped into Other so the chart stays readable; if all of them matter, a bar chart compares them more precisely, and a waffle (100 squares) shows shares in a way people count at a glance.
Negative values can’t be part of a whole, so they’re drawn as zero and the Chart step tells you.
Yes. In the Chart step choose Donut under Style. The centre shows the total, counting up as the chart sweeps in.
Yes. 45% is read as 45 with a % suffix. Slices are sized by their share of the total either way.
Yes. Add one column per year (or one row per year with the parts across); the pie morphs from each year to the next.
Yes: turn on Transparent background in Style and export Transparent video (WebM) or Image (PNG).
The Clear and Colour-blind safe palettes were checked with a colour-vision-deficiency simulation so neighbouring slices stay distinct. Labels name every slice as well.