Can I download a Flourish bar chart race as a video?
Not on the free plan. Flourish lists video export (for stories) as an Enterprise feature; otherwise you can screen-record the published race.
Guide · with a free chart maker
The data layout every race needs, then three ways to animate it: Flourish, a few lines of Python, or this site, with what each costs you in time, money and privacy.
To make a bar chart race you need a table with one row per competitor and one column per period (or one value per row), and a tool that ranks the values at each moment and animates the bars between them. Flourish, the Python library bar_chart_race and this site all do that; they differ in sign-ups, cost, video export and how much you can tweak.
If you want a video file today without an account, the tool at the top of this page opens a ready-made population race; paste your data over it and press Export video. The rest of this guide explains the data, then each method in turn.
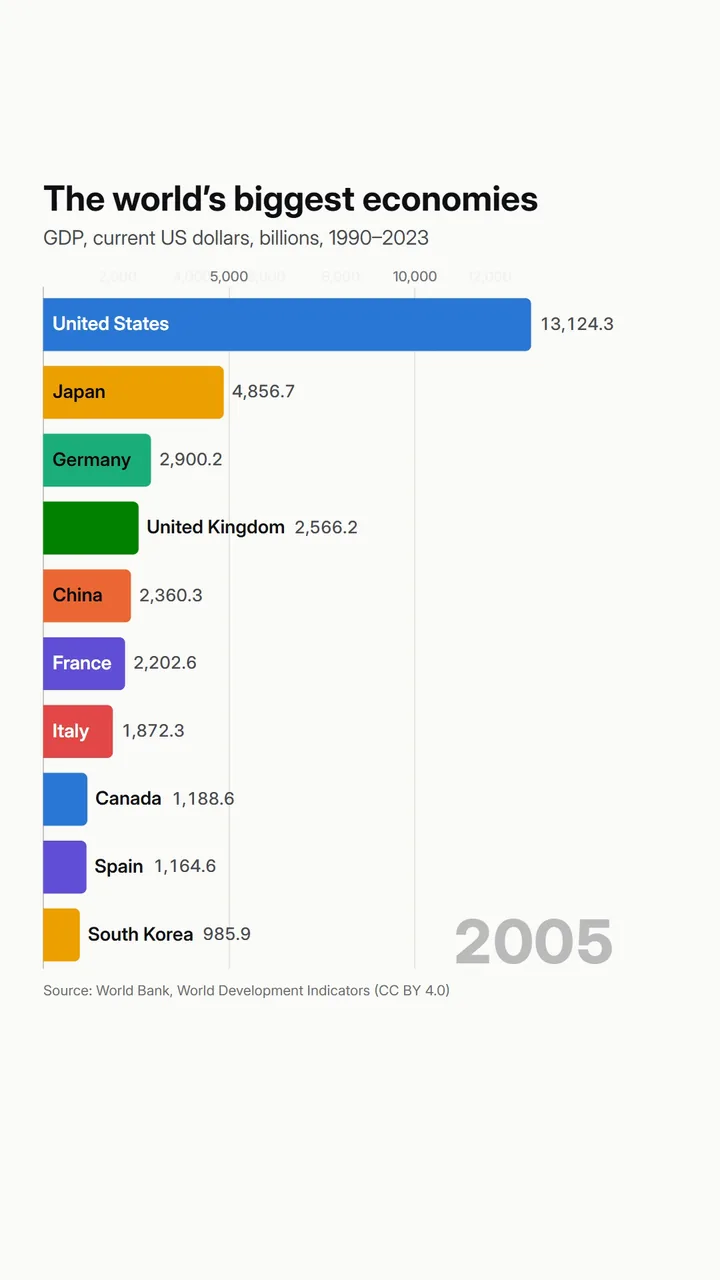 (enlarge image)
An exported frame: names inside the bars, values at their tips, the year bottom right.
The quickest route, with the tool on this page:
Select Open the Population race template at the top of the page.
In Data, choose Paste data and paste your cells, header row included.
The Data step says how the table is read, for example “Each row is one country; each number column is a period.” Switch Layout if it guessed wrong.
In Export, choose the Format, Size and Frame rate, press Export video and then Download video.
Race tools expect one of two layouts. The wide one, used by Flourish and by default here, has a row per competitor: a name, optionally a category (region, league, company group), then one column per period. The long one has a row per value: period, name, value. Spreadsheets of downloads from the World Bank, Our World in Data or a sales system are usually one or the other.
Flourish has a dedicated bar chart race template. Sign in, create a visualisation from the template, and replace the data on its Data tab: names in rows, optional image and category columns, then one column per period. Captions for particular periods go on a second sheet.
Flourish draws an excellent race, but two limits matter if you want a video: free projects are published publicly with Flourish attribution, and the free plan can’t download images or video. MP4 export is a story feature on the Enterprise plan that Flourish switches on for you; otherwise people screen-record the race. If you already have a Flourish race sheet, paste it into the tool above: it reads the same layout.
The open-source bar_chart_race package turns a pandas DataFrame (periods as rows, competitors as columns) into an MP4 or GIF with one function call, using matplotlib for drawing and ffmpeg for encoding.
It’s free and scriptable, which suits regular reports, but fonts, colours and label placement take matplotlib knowledge, and rendering long races can take minutes.
the race lives on a web page, people should be able to pause it, and your organisation already pays for Flourish.
you rebuild the same race every week from a data pipeline.
you need an MP4, GIF or vertical video now, without an account, and the data shouldn’t leave your computer. It also exports line chart races and bubble races from the same data.
Not on the free plan. Flourish lists video export (for stories) as an Enterprise feature; otherwise you can screen-record the published race.
A name for each competitor and a value for each period, either as one row per competitor with a column per period, or one row per value.
For social video, 20 to 60 seconds. Around half a second per period works for 50–60 periods; slow down for fewer periods so overtakes can be followed.
Yes, it’s open source. You also need Python, pandas, matplotlib and ffmpeg.
Not natively. Excel has no animated race chart; copy the table into a race tool such as the one on this page.