What’s the difference between Follow and Show all?
Follow grows the axes with the line, like a camera tracking it. Show all fixes the axes to the full data and draws the line across them, which suits a known range like 1960–2022.
Free · runs in your browser · no sign-up
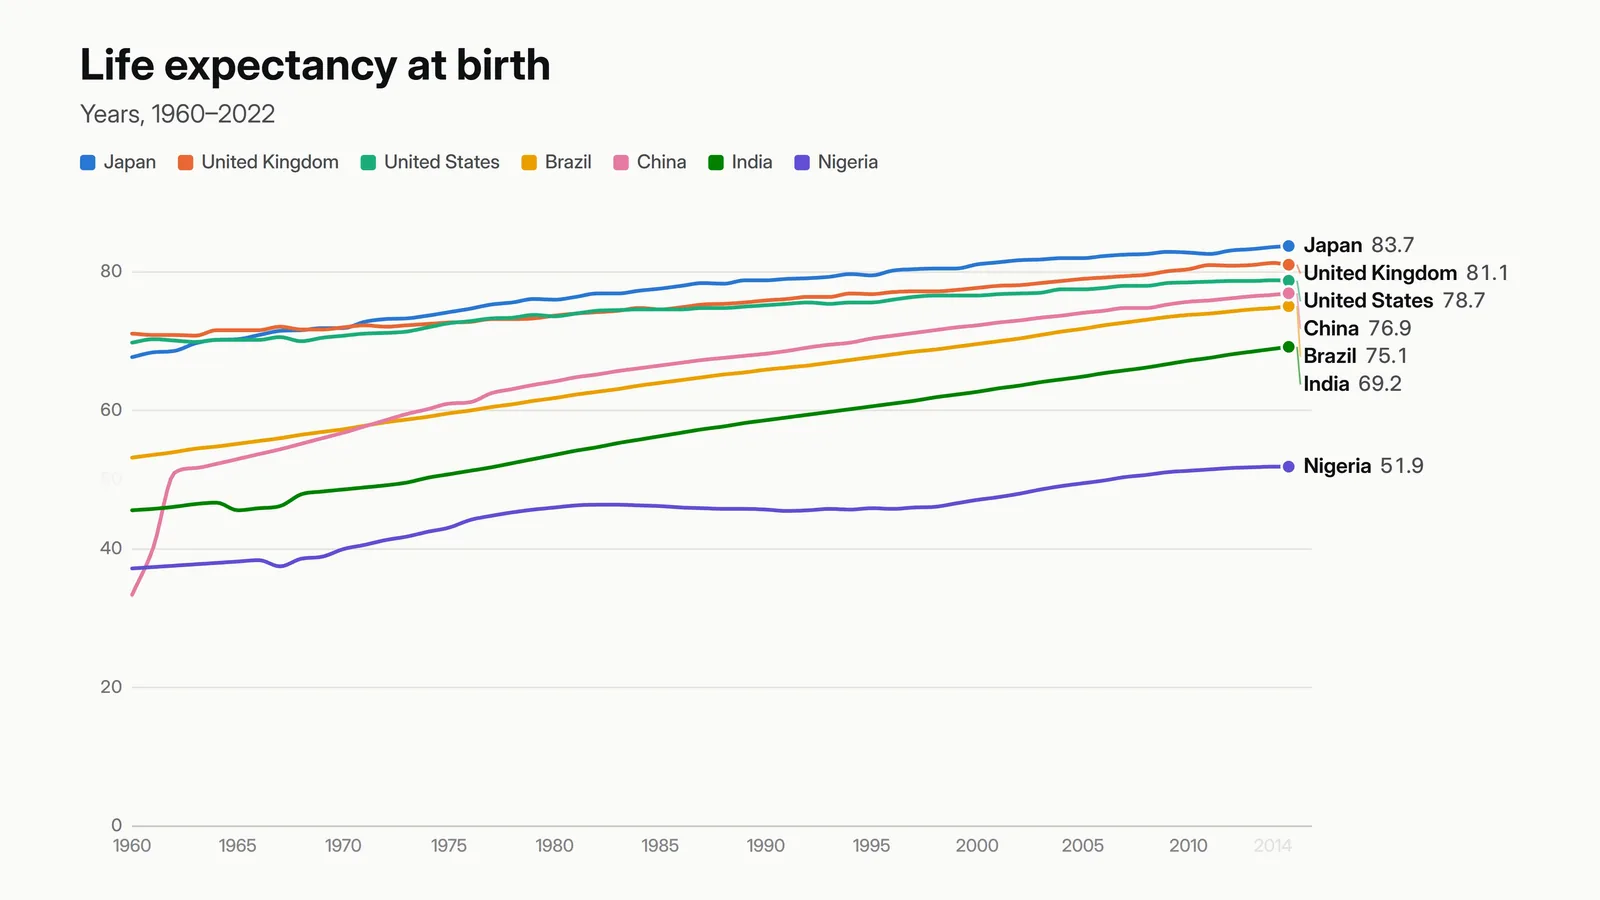
Lines draw from left to right while their end labels ride the latest value, the axes follow the action, and overlapping labels move out of each other’s way.
An animated line chart reveals a trend as it happens: the line draws period by period while a dot and a label ride its end. Open the Getting online template below, which races eight countries’ internet use since 1993, or choose Line on any page. Then paste your own series and export.
This is also what people call a line chart race: each line’s label shows its name and current value, and when lines cross, their labels slide past each other rather than overlapping. With Camera set to Follow, the x-axis grows with the line and the y-axis eases up to the highest value so far, so early years aren’t squashed flat.
 (enlarge image)
A frame from a 3840×2160 export (shown smaller): labels ride the line ends and move apart when lines meet.
Select Open the Getting online template, or pick Line under Pick a chart to start.
In Data, choose Paste data. A date or year column down the side with one column per line is the usual layout.
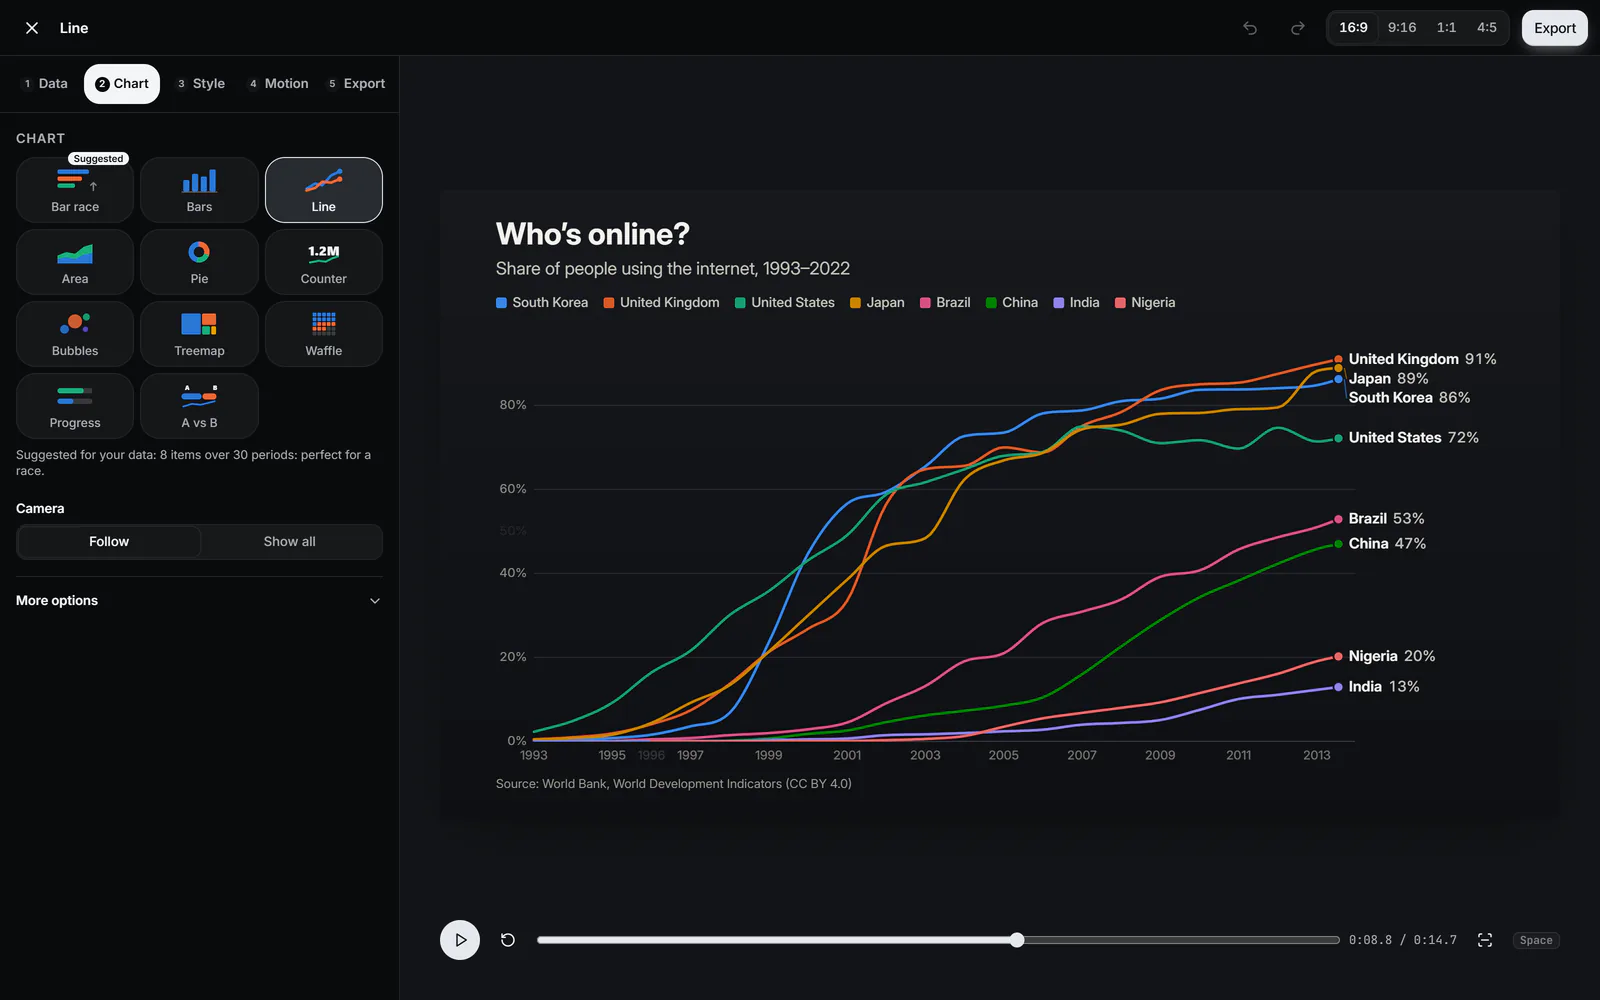
In Chart, choose Follow to zoom with the line or Show all to draw across fixed axes. Dots on data points is under More options.
 (enlarge image)
Camera: Follow or Show all.
In Motion, set Time per period (or Total length) and Hold at the end so the finished chart stays on screen.
In Export, choose the Format and Frame rate and press Export video. 60 fps gives the smoothest drawing line.
Every frame, the end labels are stacked so none overlap, inside the chart’s edges, and the arrangement is smoothed over a fraction of a second so labels glide rather than jump when two lines cross. A thin leader line joins a label to its dot when they have to sit apart.
More than about ten lines gets crowded in any chart. Hide some columns, or try a bar chart race for many items.
Switch to Area in the Chart step for the same drawing motion with filled areas. Stacked shows how parts make up a total over time; turn on 100 % stacked to show shares. Area charts can’t show negative values, and the studio says so if your data has them.
Follow grows the axes with the line, like a camera tracking it. Show all fixes the axes to the full data and draws the line across them, which suits a known range like 1960–2022.
Yes, that’s the default: each line’s label shows its name and current value at the end of the line, moving as it draws.
Yes. Choose GIF in Export. GIFs are limited to 256 colours, so smooth gradients band slightly; lines and text stay sharp.
Any number, but up to about ten stays readable. The colour order is designed so neighbouring colours remain distinct for most colour-blind viewers.
Yes. Turn on Transparent background under Style → More options and export Transparent video (WebM).