Is the bar chart race maker really free?
Yes. There’s no account, no watermark and no paid tier: MP4, GIF, transparent WebM and PNG exports are all free, at up to 4K and 60 fps.
Free · runs in your browser · no sign-up
Paste a table of names and years, press play and watch them overtake each other. Export an MP4 for YouTube, a vertical cut for TikTok, or a GIF, without an account.
A bar chart race ranks a set of things (countries, brands, players, channels) at each moment in time and animates the bars as they grow and swap places. To make one here, open the Population race template below, replace its data with yours using Paste data or Open a file, and press Export video. Everything runs in your browser, so the spreadsheet never leaves your computer.
The race is drawn by the same engine for the preview and the export, one frame at a time, so the MP4 matches what you saw. Values glide between periods instead of jumping, overtakes ease in and out rather than snapping, and the axis rescales smoothly as the leader pulls away. If you want to understand the other ways to build one, the bar chart race guide compares Flourish, Python and this page honestly.
 (enlarge image)
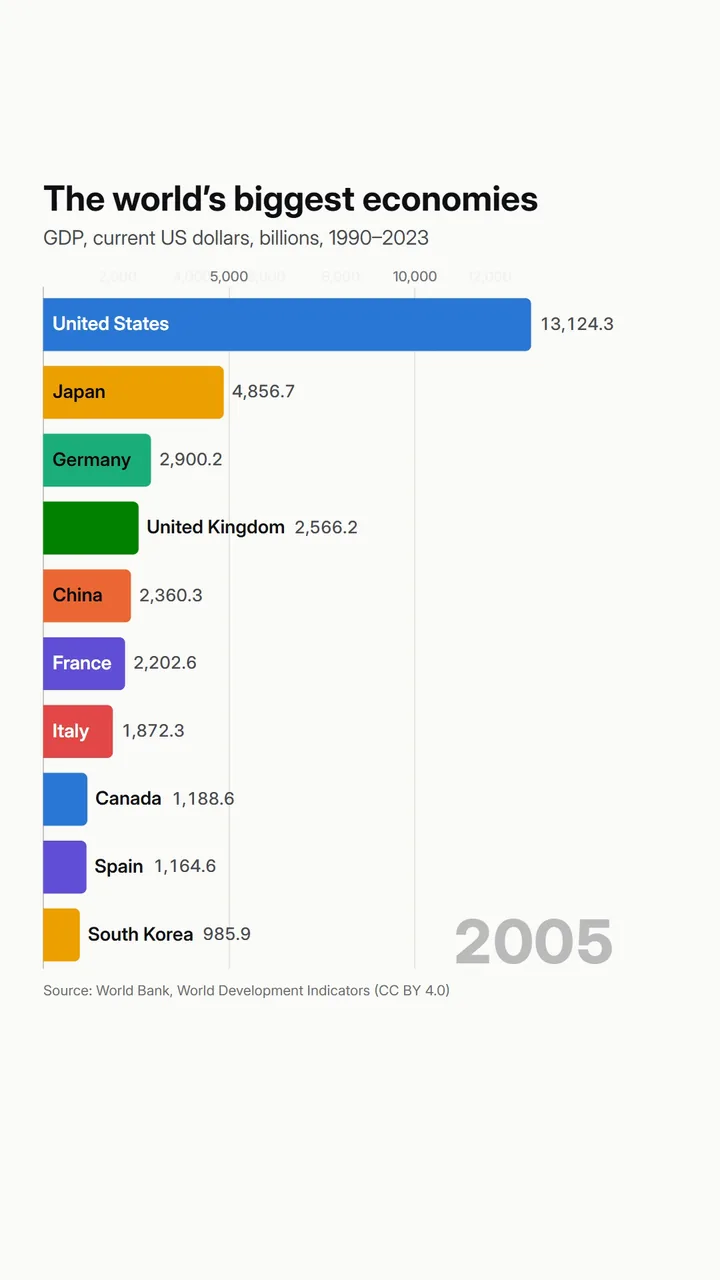
A frame from an exported 1080×1920 race at 60 fps.
Select Open the Population race template. The studio opens with World Bank population data already racing.
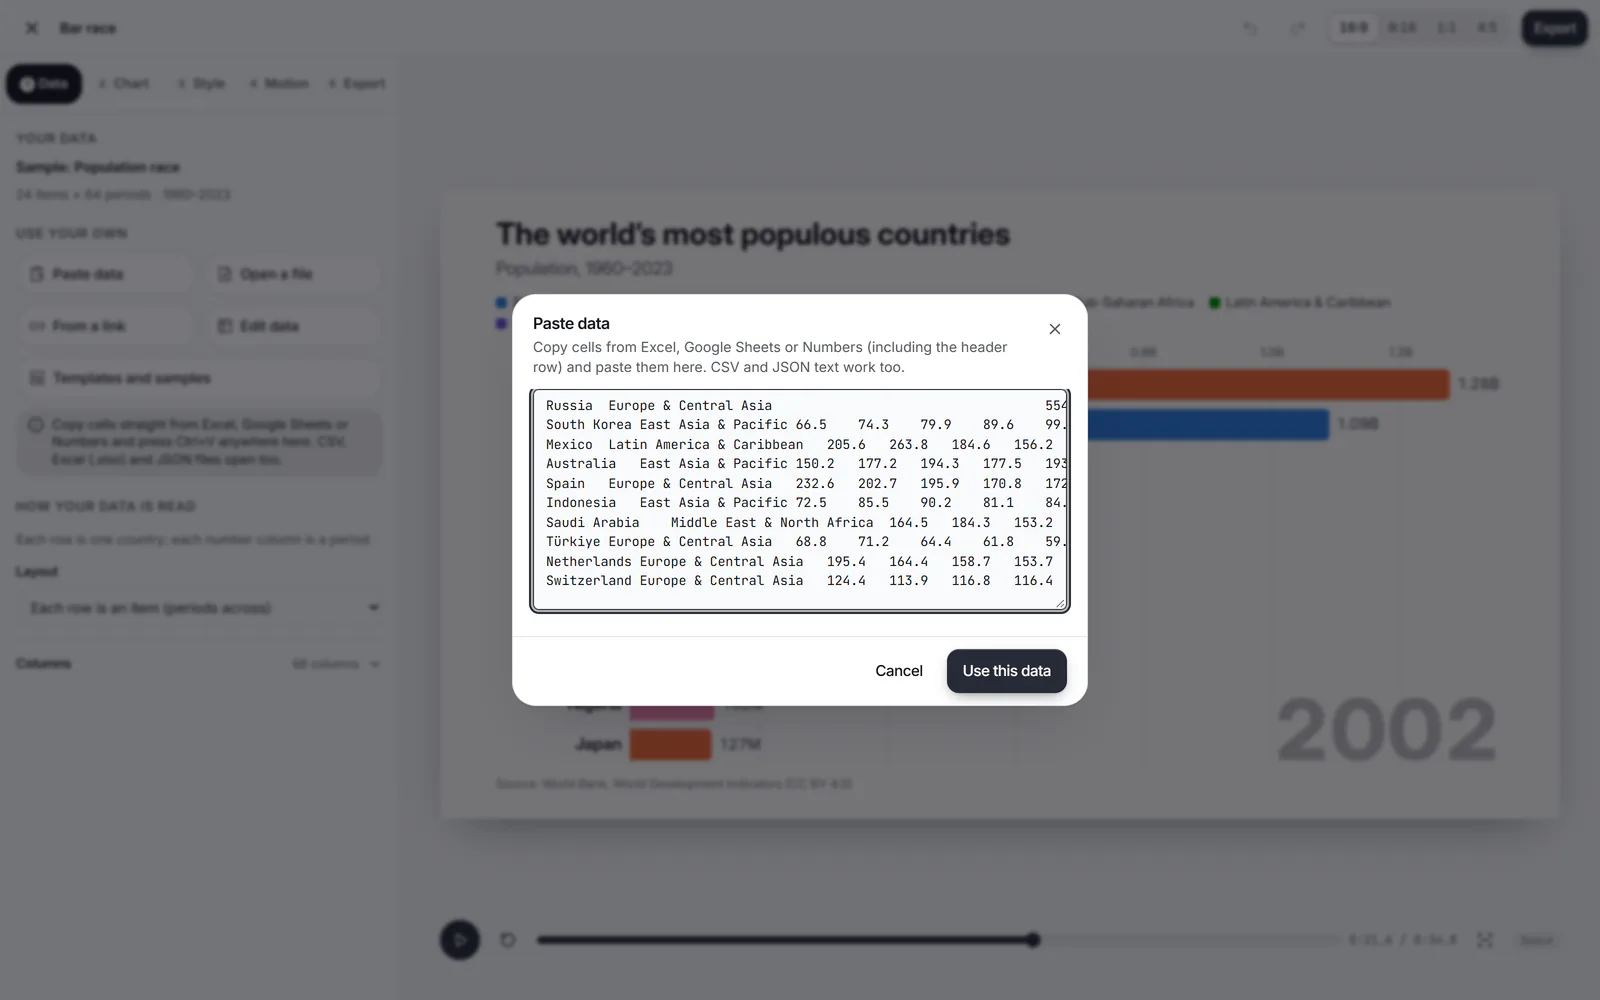
In Data, choose Paste data and paste cells straight from Excel or Google Sheets, or Open a file for a CSV or .xlsx. Names go down the first column and each period gets its own column; a table with one value per row works too.
 (enlarge image)
Paste cells in Paste data, then Use this data.
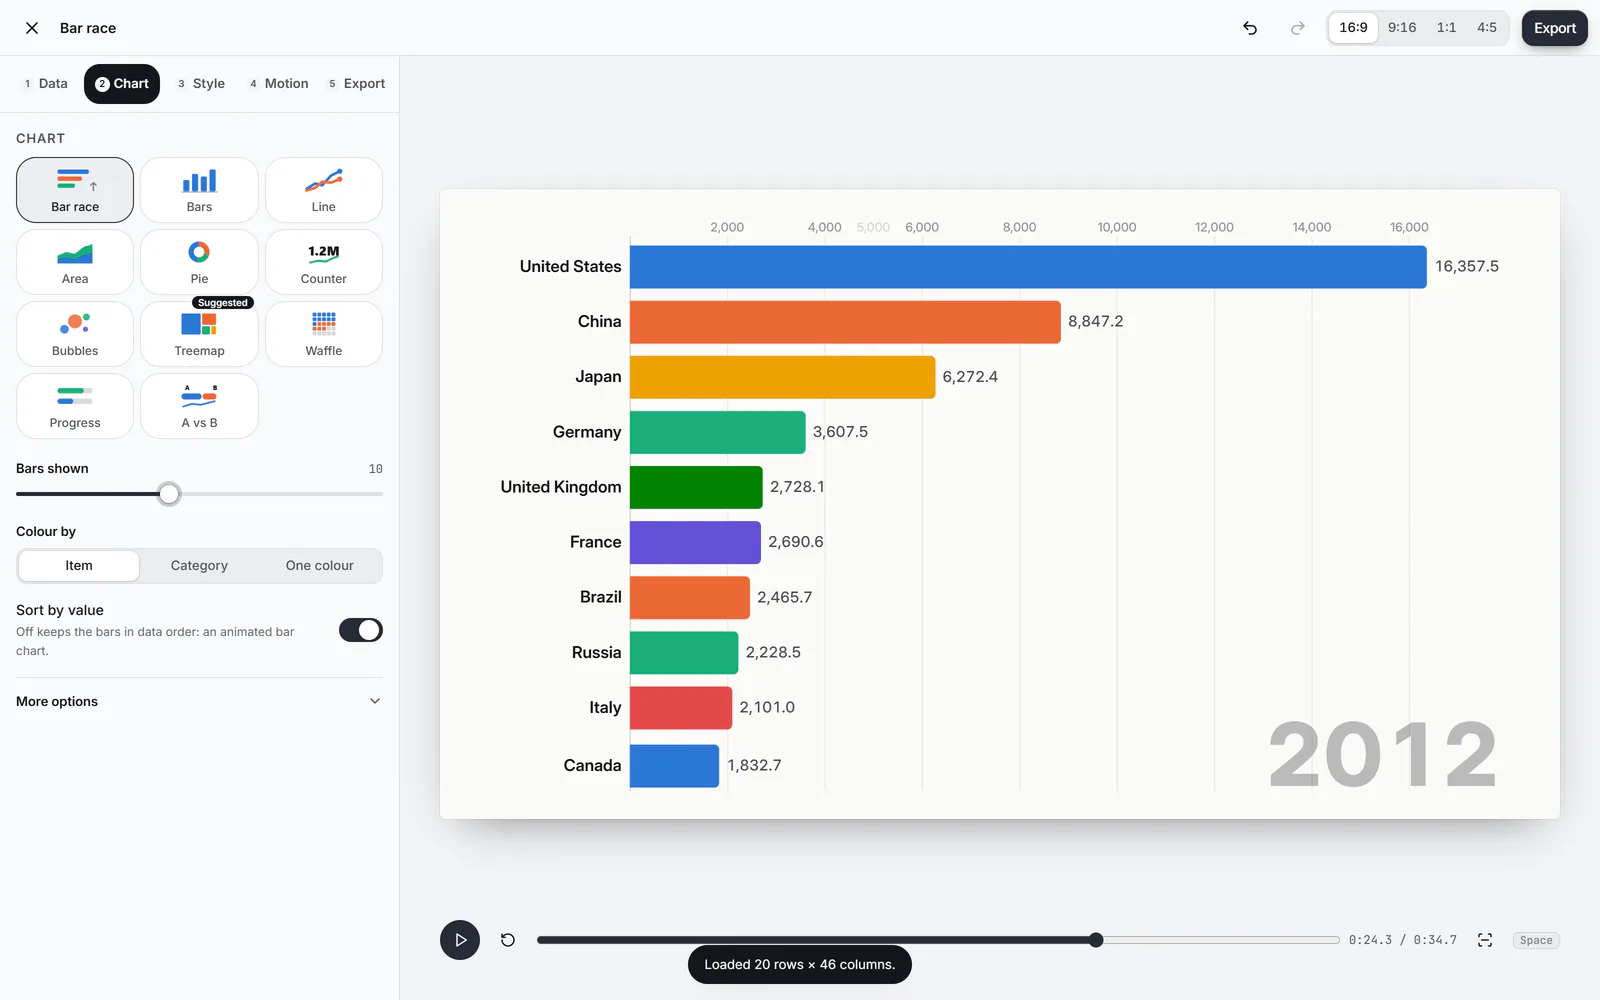
In Chart, set Bars shown and Colour by (item or category). In Motion, set Time per period or a Total length, and how long to Hold at the end.
 (enlarge image)
Bars shown, Colour by and Sort by value in the Chart step.
In Style, write the Title, Subtitle and Source, pick a Theme, and add your logo under More options if you like.
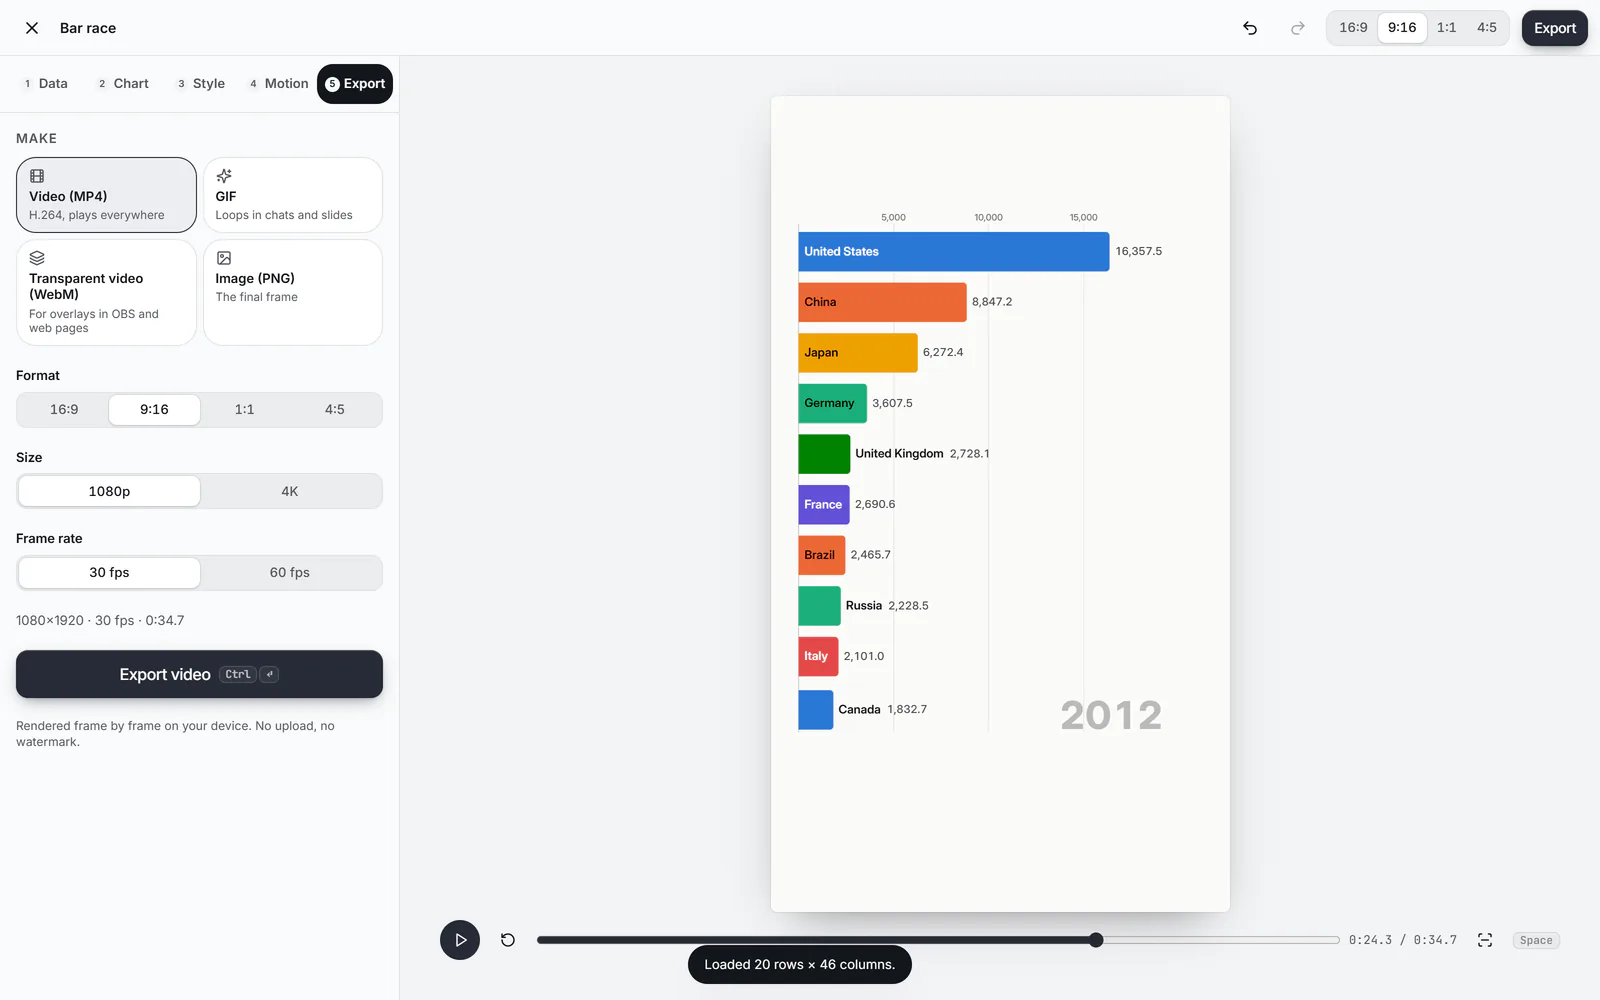
In Export, keep Video (MP4), choose the Format (16:9 for YouTube, 9:16 for Shorts, TikTok and Reels), Size and Frame rate, then Export video and Download video.
 (enlarge image)
Choose 9:16 for Shorts, TikTok and Reels.
The race reads the layout most race data already uses: one row per item, with a name column, an optional category column (a region, a team, a brand family) and one numeric column per period. Column headers like 1990, 2024 Q1, Mar 2024 or 2024-03-01 are recognised as periods and put in date order.
If your sheet runs the other way, with a date column down the side and one column per item, choose Each row is a period under Layout in the Data step. Long tables with one value per row (Year, Country, Value) are read too; the studio works out which column is which, and the Columns section lets you correct it.
Each bar’s place is worked out from the values, then eased over a short window centred on the moment one bar passes another, so overtakes glide instead of snapping. Overtaking speed under Motion → More options makes swaps quicker or more relaxed.
Values are drawn with fixed-width digits, so a number counting up doesn’t wobble, and Shorten big numbers (1.2M) keeps long figures readable. Set a prefix like $ or a suffix like bn under Style → More options → Numbers.
A country keeps its colour wherever it ranks. With a category column, Colour by → Category colours by group and adds a legend. Every bar also carries its name, so colour is never the only clue.
A sixty-year race at 0.5 seconds per year runs for about half a minute. Use Total length if you need an exact running time, for example to fit a voiceover, or add your own track under Motion → Add music and press Match length to music.
Exports come out at 1920×1080 or 3840×2160 for 16:9, 1080×1920 or 2160×3840 for 9:16, and square or 4:5 for feeds, at 30 or 60 frames per second. Keep clear of app buttons keeps titles out of the areas TikTok, Reels and Shorts cover with their own buttons.
Yes. There’s no account, no watermark and no paid tier: MP4, GIF, transparent WebM and PNG exports are all free, at up to 4K and 60 fps.
No. Your browser reads the file or the pasted cells and draws every frame itself. Nothing about your data is sent to chart.video.
Yes. Flourish’s race layout (a name column, optional category and image columns, then one column per period) is the layout this page reads by default. Image columns are ignored.
Between 3 and 20 at a time, set with Bars shown. Your table can have many more items; they slide in from below as they climb into view.
Yes. Turn off Sort by value in the Chart step for an animated bar chart where the bars grow and shrink in place.
It won’t be when the years are column headers or a date column: they’re read as periods. If you see that, the years have been read as values; switch the Layout in the Data step.
Not yet. Bars carry the item name and value, and you can add your own logo to a corner of the video.